
SaaS Statistics:
150+ Shocking Numbers That Reveal a $466B Industry in 2026
Your 2026 SaaS statistics guide: market size, AI adoption, churn benchmarks, VC funding, and security data — 150+ verified figures, all in one place.
⚡ Key SaaS Statistics at a Glance (2026)
The SaaS industry has crossed a point of no return. In 2026, the global market sits at an estimated $466 billion and is on a clear path toward $1+ trillion by 2027. Nearly every organization on earth now runs on SaaS — the average company deploys over 100 different applications, and 80% of enterprises have already started rolling out AI-powered features inside their software stacks. If you work in tech, build products, or manage software budgets, these numbers are the baseline you need to understand where the market is heading.
You already use SaaS every day — your email, your CRM, your project management tool, your video conferencing app. What most people don’t grasp is how enormous and fast-moving the industry behind those tools has become. The SaaS statistics for 2026 tell a story of relentless growth, surging AI adoption, and structural waste that quietly costs enterprises millions.
In 2017, the average company ran just 16 SaaS applications. By 2026, that number jumped to 112. Enterprise organizations with 5,000+ employees now run 158 different apps. That is not a slow shift — that is a fundamental change in how businesses operate globally.
But the SaaS growth rate brings complexity with it. SaaS waste now costs enterprises an average of $21 million per year. Security misconfigurations cause up to 65% of organizational security problems. Churn rates vary from 1% monthly for enterprise contracts to 7% for SMB tools. The SaaS market size is booming and full of traps for builders and buyers alike.
This guide pulls together 150+ verified SaaS market statistics 2026 — covering market size, regional adoption, AI trends, churn benchmarks, security risks, VC funding, and mobile usage. Sources include Gartner (which tracks end-user SaaS spending at $247.2B for 2024), Vena Solutions research, and Backlinko’s 2026 analysis. Broader market estimates that include adjacent cloud and platform revenue, cited by industry analysts, place the total addressable SaaS market at $466B in 2026. Whether you’re a founder, investor, or product manager, these numbers give you a grounded view of where the software as a service industry stands right now.
SaaS Market Size & Growth Statistics (2026)
The SaaS growth rate remains one of the most consistent stories in tech. Even with macro headwinds and tighter VC spending, end-user demand for cloud software keeps climbing year over year — and the underlying SaaS market size shows no sign of plateauing.
Market Size Milestones
- The global SaaS market is estimated to reach $466 billion in 2026, according to industry analysis.
- Gartner tracked worldwide end-user SaaS spending at $206B in 2023, climbing to $247.2B in 2024 — a 20% year-over-year increase.
- Vena Solutions’ research puts the 2024 market at $317.55B when including all SaaS-adjacent segments, with projections reaching $1,228.87B by 2032.
- End-user SaaS spending is projected to surpass $1 trillion by 2027.
- The 2025 SaaS market worldwide is projected at $390.50B, growing to $793.10B by 2029.
- The market is on track to exceed $1.13 trillion by 2032.
Growth Rate & CAGR Data
- Worldwide SaaS revenue growth rate: 19.38% annually from 2025 to 2029.
- CAGR from 2024 to 2032 is projected at 18.4%, according to Vena Solutions’ research.
- Worldwide end-user SaaS spending saw a 19.4% year-over-year increase in recent reporting periods.
- Median growth rate for public SaaS companies (as of October 2024): 30%, down slightly from 35% in 2023.
- Private SaaS companies with ARR below $1M show the highest median growth at 50%.
- The largest private SaaS companies (ARR above $20M) show the lowest median growth at 25%.
Cloud Market Context
- SaaS accounts for 36.6% — the largest share of the entire cloud services market.
- SaaS represents more than half of the entire software market globally.
- Worldwide public cloud spending reached $723.4B in 2025, up from $595.7B in 2024.
- 90% of organizations are predicted to adopt hybrid cloud infrastructure through 2027.
- 80% of businesses adopted Microsoft Azure’s public cloud in 2024.
- 86% of enterprise buyers plan to raise or maintain SaaS budgets — 41% plan to increase spending, 45% plan to maintain current levels.
- ~99% of organizations use at least one SaaS solution.
Bottom line: The SaaS market is not slowing down. Despite post-2021 VC corrections, end-user demand continues to outpace most other technology segments. The path to $1 trillion is already mapped out.
SaaS Market Statistics by Region: North America, Europe & Asia-Pacific
SaaS adoption is global, but the market is far from evenly distributed. North America dominates in absolute size, Asia-Pacific leads in growth rate, and Europe is catching up with its own compliance-driven requirements.
North America
- North America holds 47.85% to 48% of the global SaaS market — the dominant region worldwide.
- North America generated $131.18B in 2023, according to Vena Solutions’ research.
- The US market alone is projected to reach $211.7B by 2026.
- The US is home to 17,000+ SaaS companies, the largest concentration on earth.
- Backlinko reports 12,400 SaaS companies specifically in the US, the largest share of any country.
- US SaaS companies serve approximately 14 billion users worldwide.
Europe
- European SaaS market revenue reached $95.02B in 2025.
- Europe is the strong second globally, with growth driven by GDPR-compliant cloud tools.
- GDPR regulations are pushing “data residency” options into core SaaS infrastructure across the region.
- The UK has 1,700 SaaS companies; Germany has 916.
Asia-Pacific
- Asia-Pacific is the fastest-growing SaaS region with a CAGR of 22-24% through 2030.
- India’s SaaS revenue is on track to cross $26B by 2026.
- India counts 1,100 SaaS companies; Canada also has 1,100.
- VC funding in software in India rose 1.2x to $1.7B in recent key market periods.
Insight: Vertical SaaS growth comes in slightly higher (31%) versus horizontal SaaS (28%), suggesting niche market tools are capturing a disproportionate share of new growth — especially in Asia-Pacific and emerging markets.
Software as a Service Adoption & Usage Statistics
How many apps does the average company actually run? The numbers are higher than most people expect — and they tell a story about both adoption efficiency and waste.
Apps Per Company (By Employee Count)
| Company Size | Avg SaaS Apps Used |
|---|---|
| Under 200 employees | 42 apps |
| 200–749 employees | 103 apps |
| 750–1,499 employees | 86 apps |
| 1,500–4,999 employees | 142 apps |
| 5,000+ employees | 158 apps |
| Overall average (Backlinko 2026) | 112 apps |
Usage Trends
- The average company used 16 SaaS apps in 2017, 80 apps in 2020, and 112 apps by 2026 — a 7x increase in under a decade.
- Companies now use 220 SaaS apps in 2024 when including shadow IT and departmental tools (Vena Solutions), down from 371 in 2023 due to consolidation.
- Small businesses (1–150 employees) use 77 apps on average.
- 53% of organizations consolidated redundant SaaS apps in 2024 — a 40% jump from the prior year.
- Average spend per employee: $1,000–$3,500 per year, with some estimates putting the SaaS spend per employee at $5,607 when enterprise tooling is included.
Process Automation
- 81% of organizations have fully automated at least one core business process using SaaS tools.
- 90% of IT professionals say automation is key; 64% say it significantly reduced manual work.
- 3 out of 4 IT professionals say they want SaaS with insights-driven automation built in.
- Operations teams grew their SaaS portfolio from 74 to 87 apps over recent reporting periods.
- Customer success teams show the lowest growth rate at 5%, averaging 61 apps.
- SaaS purchases are overseen by an average of 5 people, with 44% including the finance team.
The Waste Problem
- 53% of SaaS licenses go completely unused.
- Wasted SaaS costs the average enterprise $21 million per year.
- Only 26% of organizations actively use automated tools to monitor or reduce SaaS waste.
- Shadow IT dropped from 53% to 48% between 2022 and 2023 — but remains a persistent problem.
- 69% of IT professionals say shadow IT is their top SaaS concern in 2024.
Warning: Despite heavy investment, over half of purchased SaaS licenses are never activated. Before scaling your software stack, auditing current usage can save enterprises millions. ChatGPT has even claimed the #1 spot on shadow IT charts — unsanctioned AI tools are the newest blind spot for IT teams.
SaaS Revenue, Pricing Model & Budget Statistics
How SaaS companies price their products — and how customers actually pay — shapes everything from churn to growth trajectories. The pricing landscape in 2026 looks quite different from the flat-rate-subscription model that dominated a decade ago.
Revenue Benchmarks
- Large enterprises (1,000+ employees) account for 60%+ of global SaaS revenue.
- Public SaaS companies average 36,000 customers.
- Median ARR per employee for private SaaS in 2024: $125,000.
- Enterprise SaaS companies (ARR above $20M): $186,661 ARR per employee.
- Small SaaS (ARR below $1M): $50,091 ARR per employee.
- Private SaaS Net Revenue Retention (NRR): 100% for smaller companies (<$1M ARR), rising to 104% for larger ones (>$20M ARR).
- Top performers maintain NRR above 120%; industry median NRR sits at 101%.
- 5.3% of SaaS companies reported flat or negative growth in 2023, up from 3.1% in 2022.
Pricing Strategies
- 39% use value-based pricing; 24% simply copy competitor prices.
- 45% of SaaS companies publish pricing openly; 55% do not.
- Between August 2022 and August 2023, 73% of SaaS providers raised prices by an average of 12%.
- Hybrid pricing (subscription + usage fees) is becoming the dominant model for growth-stage companies.
- Usage-based pricing is preferred over flat access for high-volume and developer-focused products.
- 68% of companies discount in fewer than 1 in 4 deals — aggressive discounting is not the norm.
Budget Allocation
- 85% of SaaS budgets are spent on renewals; only 15% goes toward new software purchases.
- Q4 2023: new software purchases represented only 11% of total SaaS spend.
- Median spend on R&D as share of ARR: 18% (down from 24% in 2023).
- Median spend on G&A as share of ARR: 11% (down from 15% in 2023).
- Equity-backed SaaS companies spend 90% more on sales and 82% more on G&A than bootstrapped counterparts.
- 60% of businesses say finance decision-makers don’t have a seat at the table for strategic software planning.
- 39% of companies don’t practice agile planning, limiting their ability to respond to fast-moving SaaS market changes (Vena Solutions).
- 55% of organizations don’t adjust forecasts when updated information becomes available.
Note on NRR: Net Revenue Retention above 100% means existing customers are spending more over time (through upgrades, seats, or usage). Companies hitting 120%+ NRR effectively grow revenue without acquiring a single new customer — making it one of the most important metrics in SaaS finance.
AI in SaaS: Industry Trends & Adoption Statistics
AI has moved from a feature on pitch decks to actual deployed infrastructure. One of the clearest SaaS industry trends right now is that GenAI is no longer an experiment — it’s a production requirement. The numbers below show how fast that shift happened and where it is heading over the next two years.
AI Market Size
- The AI-created SaaS market reached $101.73B in 2025 and is projected to hit $770.32B by 2031 at a CAGR of 40.2%.
- The global AI software market grew from $16.98B in 2024 to an expected $80.6B by 2031 at a CAGR of 29.64%.
- Private AI investments globally: $200B total, with $100B in the US alone by 2025.
- Machine learning accounts for 41.3% of AI-created SaaS market revenue.
- Revenue from AI data services (MLOps) is expected to nearly quadruple between 2024 and 2028.
Enterprise AI Adoption
- By 2026: 80% of enterprises will have actively deployed GenAI-enabled applications (up from just 5% in 2023).
- 71% of organizations are “100% certain” or “extremely likely” to invest in AI-powered software, according to Backlinko’s analysis.
- Only 8% of organizations say they are not at all likely to invest in AI software.
- By 2028: generative AI is projected to lead to a 30% drop in noncompliance risk for enterprise software deployments.
- Gartner projects AI deployments will generate $80B+ in cost savings by 2026.
AI-Driven Support & Operations
- AI-driven support tools show a 3.5x improvement in customer satisfaction scores compared to traditional support systems.
- By 2027: AI agents are expected to replace many traditional SaaS interfaces for routine workflows.
- 64% of all VC deal value in recent periods went to AI-related companies.
- By 2026: no-code platforms will allow non-technical founders to build complex SaaS products at scale.
- By 2028: 50%+ of enterprise businesses will rely on industry cloud platforms powered by AI.
Key signal: The jump from 5% AI deployment in 2023 to 80% by 2026 is not gradual — it is a step change. Companies that are not actively piloting GenAI features inside their products right now will face a significant competitive gap within 18 months.
SaaS Churn Rate & Customer Acquisition Cost (CAC) Statistics
Churn and CAC are the two metrics that determine whether a SaaS business is actually healthy — or just growing on top of a leaky bucket. Here’s where benchmarks sit in 2026.
Churn Rate Benchmarks
| Segment | Monthly Churn Rate | Notes |
|---|---|---|
| Enterprise contracts | ~1% | Long-term contracts, high switching costs |
| Mid-market tools | 2–4% | Moderate engagement, annual billing helps |
| SMB tools | 3–7% | High volume, smaller teams, frequent reassessment |
| Low-cost products (<$25 ARPU) | 6.1% | Low switching friction = high churn risk |
| High-ticket tools (>$1,000 ARPU) | 1.8% | Deeper integrations, higher exit cost |
| Average B2B SaaS (overall) | 4.1% | Voluntary: 3.0%, Involuntary: 1.1% |
- Average annual SaaS churn rate: 5–7%, according to Vena Solutions’ research.
- A 5% reduction in churn translates to a 25–95% increase in profitability, depending on margins.
- Involuntary churn (failed payments, expired cards) accounts for roughly 1.1% of average churn — meaning a significant portion is preventable with better dunning flows.
Customer Acquisition Cost (CAC)
| Segment | Typical CAC Range |
|---|---|
| General B2B SaaS | $200–$700 |
| Enterprise SaaS sales | $4,000–$11,000 |
| Fintech SaaS (B2B) | $6,000+ |
| Median new ARR cost ratio | $2 spent per $1 ARR |
- CAC is rising at 14% per year due to ad saturation and privacy-driven attribution challenges.
- The median cost to acquire $1 in new ARR is now $2 in sales and marketing spend.
- Marketing spend for small SaaS (under $10M ARR): typically 20–35% of revenue.
- Average Cost Per Lead (CPL) for B2B SaaS in the US: approximately $310.
- 89% of businesses use video as a primary SaaS marketing tool.
- Blogging companies generate 67% more leads than those that don’t publish content.
Watch out: With CAC rising 14% annually and median spend at $2 for every $1 of new ARR, SaaS companies need to pair acquisition with aggressive retention. A churny product with high CAC is a structural problem no amount of marketing spend can fix long-term.
SaaS Security Statistics: Risks, Misconfigurations & Threats
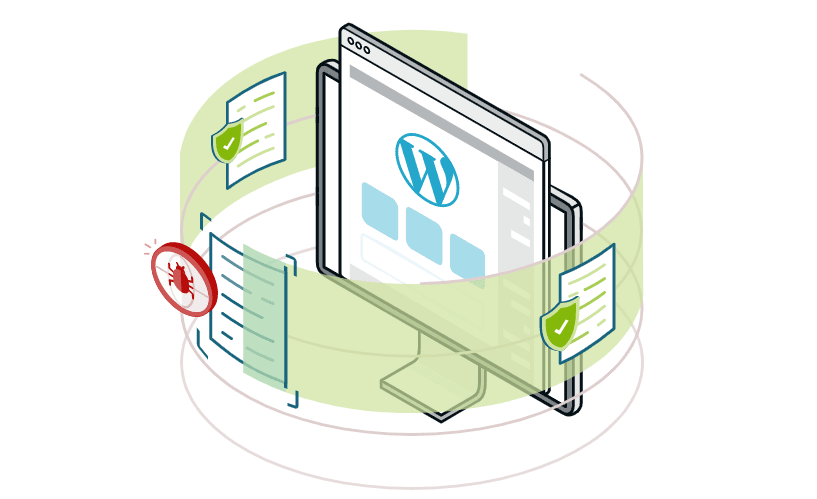
As SaaS adoption grows, so does the attack surface. Security is now the #1 priority for software buyers — ahead of ease of use and integrations — and the statistics show exactly why.
Security Market Size
- The SaaS security market is projected to reach $35B by 2035, up from $8.55B in 2024.
- Ransomware attacks targeting SaaS data increased by 13% in recent periods.
- 81% of B2B buyers check security credentials before engaging with a vendor’s sales team.
- 38% of businesses face security concerns when planning software investments.
Misconfiguration Risk
- SaaS misconfigurations cause up to 65% of organizational security problems.
- 73% of organizations say achieving visibility into SaaS security risks is the most difficult aspect of their security posture.
- 46% of organizations only conduct monthly or less frequent checks for misconfigurations — leaving long windows of exposure.
- 70% of organizations now have dedicated SaaS security teams or designated staff.
- 39% increased their SaaS security budgets in the past year.
Access Control & Insider Threats
- 31% of companies discovered that former employees continued to access SaaS applications after leaving the organization.
- Insider threats account for 22% of all security problems.
- 59% of SaaS executives say offboarding departing employees is their top security concern.
- 45% of organizations say they have difficulty securing SaaS user activities and access logs.
- 33% of IT professionals implemented a new SaaS solution storing sensitive data in the past year without a formal security review.
Geopolitical & Compliance Risk
- More than 50% of subscribers have been directly affected by SaaS contract defaults tied to geopolitical issues.
- GDPR is forcing data residency options into core SaaS infrastructure across Europe.
- By 2028, generative AI is expected to drive a 30% reduction in noncompliance risk through automated policy enforcement.
Security is the #1 buying criterion. According to Vena Solutions’ research, buyers rank security above ease of use and integrations when evaluating new SaaS products. Building security features into the core product — not as an afterthought — is now a competitive requirement, not a nice-to-have.
Vertical SaaS Statistics: Niche Market Size & Growth Rates
Vertical SaaS — software built for a specific industry rather than general use — is one of the fastest-growing segments in the entire market. Smaller total addressable markets but higher retention, deeper integrations, and stronger pricing power.
Market Size by Vertical
- Global vertical SaaS market: projected at $369B by 2033 at a CAGR of 16.3%.
- CRM is the largest SaaS vertical, with market size expected to reach $139.73B by 2030.
- Healthcare cloud SaaS: projected to reach $452.4B by 2029.
- HR SaaS: growing at 8.5% CAGR through 2026, driven by remote work infrastructure needs.
- Vertical SaaS companies trade at higher valuation multiples due to lower competition and deeper customer integrations.
- Vertical SaaS shows 31% median growth versus 28% for horizontal platforms.
Micro-SaaS & Solopreneur Stats
- The micro-SaaS market is projected to reach $360B by 2026 at a CAGR of 19%.
- Micro-SaaS captures approximately 25% of total SaaS market value.
- Most micro-SaaS founders operate with zero full-time employees — entirely bootstrapped.
- Micro-SaaS products have become prime acquisition targets for private equity due to predictable recurring revenue.
Industry Cloud Platforms
- By 2028: 50%+ of enterprise businesses will rely on industry cloud platforms — vertical SaaS built on top of major cloud providers.
- 4 out of 5 tech companies cite integrations as “very important” to their customers.
- 39% of buyers identify integration with current software as the most important buying factor.
Opportunity signal: Micro-SaaS is not a niche anymore — it’s a $360B market capturing a quarter of all SaaS value. Solo founders building deeply specialized tools for a single vertical or workflow are finding buyers willing to pay premium prices and stay for years.
SaaS VC Funding & Investment Statistics (2020–2025)
After the 2021 peak, SaaS valuations and funding volumes corrected sharply. But the floor held — and by 2024, capital started flowing back in, especially toward AI-enabled companies.
Global VC Investment Trends
| Year | Global VC Investment (SaaS) | Trend |
|---|---|---|
| 2020 | $115.1B | Pre-pandemic acceleration |
| 2021 | $273.7B | Peak — driven by zero-interest-rate era |
| 2022 | $205.6B | First contraction |
| 2023 | $116.7B | Major correction |
| 2024 | $161.1B | Recovery — AI driving return |
| 2025 | $100.2B | Selective, AI-concentrated |
US-Specific Funding Data
- US SaaS startups raised $17.4B in VC investments in 2023 across 880 rounds.
- By May 2024: $4.7B across 282 rounds in the US alone.
- SaaS startups captured 47% of all VC funding in 2023, up from 36% in 2019.
- VC investments in SaaS worldwide in H1 2024: $72.3B.
- Enterprise SaaS: $21.9B in Q2 2024 VC funding across 713 rounds.
- Early-stage VC deal investment in H1 2024: $10.3B — a 20.16% year-over-year decrease.
Valuations & AI Premium
- SaaS startup valuations have corrected to approximately 6.6x revenue — down from the 15x peaks of 2021.
- 64% of all VC deal value is now directed toward AI-related companies.
- VC funding for tech startups overall increased 21% year-over-year from 2023 to 2024, totaling $184B.
- According to Vena Solutions research, there are 1,566 software companies with valuations exceeding $1 trillion.
- Microsoft carries a $2.3T market cap, anchoring the top of the SaaS ecosystem.
Valuation reality check: The days of 15x ARR multiples for average SaaS companies are gone. At 6.6x, investors are applying far more scrutiny to growth rates, NRR, and profitability paths. AI-native products are the exception — they still command premium multiples if they show genuine defensibility.
Mobile SaaS Statistics & Integration Trends

Mobile-first is no longer a trend — it’s a baseline expectation. More than half of all web traffic now comes from mobile devices, and SaaS products that haven’t optimized for smaller screens are paying the price in conversions.
Mobile Traffic & Usage
- Mobile devices account for 58.67% of global website traffic as of Q4 2023.
- By 2025: 72.6% of internet users will access the web solely or primarily via mobile.
- Mobile traffic varies sharply by region: Nigeria at 86.67%, Vietnam at 86.51%, UK at 48.71%, and the US at 44.25%.
- The average individual now uses their mobile device for 4+ hours daily.
- Mobile apps are projected to generate $935B+ in global revenue.
- 77% of smartphone shoppers prefer mobile-optimized sites when evaluating software purchases.
Mobile Conversion & Performance
- A 1-second delay in mobile page load time causes a 26% drop in conversions.
- 50.48% of all conversions now happen on mobile; 49.52% on desktop — effectively tied.
- By end of 2026: 50% of organizations will centralize SaaS management platforms with mobile-first interfaces.
Integration Priorities
- Buyers rank integrations as the #3 buying priority — behind security (#1) and ease of use (#2).
- 4 out of 5 tech companies say integrations are “very important” to their customers.
- 39% of buyers identify integration with current software as the single most important factor in their purchase decision.
- 2 out of 5 B2B professionals say integrating a new CRM is a major roadblock in their operations.
- 60% of businesses budgeted more on software in 2024 specifically to address integration gaps.
Integration as a growth lever: Buyers who can’t connect your product to their existing stack will buy a different product. With 112 apps running per company on average, interoperability isn’t a feature — it’s a survival requirement. Products with strong native integrations consistently show lower churn rates.
SaaS Statistics FAQ: Common Questions Answered
What is the current size of the global SaaS market in 2026?
The global SaaS market is estimated to reach $466 billion in 2026. Gartner tracked end-user SaaS spending at $247.2B in 2024, and multiple research sources project the broader market — including adjacent cloud software segments — will surpass $390B to $466B in 2026 depending on methodology. All projections point toward $1+ trillion by 2027–2032.
How many SaaS companies exist worldwide?
There are over 42,000 SaaS companies worldwide, according to Backlinko’s analysis. The US alone accounts for 12,400–17,000 companies depending on the source definition. The UK, Canada, India, and Germany round out the top five countries by company count.
How many SaaS apps does the average company use?
The average company uses 112 SaaS applications as of 2026, up from just 16 in 2017. The number varies significantly by company size:
- Under 200 employees: 42 apps
- 1,500–4,999 employees: 142 apps
- 5,000+ employees: 158 apps
However, 53% of those licenses go unused — meaning SaaS waste is a major operational problem at most companies.
What is the average SaaS churn rate?
The average B2B SaaS monthly churn rate is 4.1% overall — split between 3.0% voluntary and 1.1% involuntary. Annual churn benchmarks range from 5–7%. Enterprise contracts see much lower churn (~1% monthly) while SMB tools can see 3–7% monthly. Products under $25 ARPU have the highest churn at 6.1%; high-ticket tools above $1,000 ARPU see only 1.8%.
What percentage of enterprises are deploying AI in SaaS?
By 2026, 80% of enterprises will have actively deployed GenAI-enabled applications — up from just 5% in 2023. Meanwhile, 71% of organizations say they are “100% certain” or “extremely likely” to invest in AI-powered software in the near term. The AI-created SaaS market alone is projected to reach $770B+ by 2031.
What is the fastest-growing SaaS region?
Asia-Pacific is the fastest-growing SaaS region globally, with a CAGR of 22–24% through 2030. India’s SaaS revenue is on track to cross $26B by 2026, and VC funding in the region continues to accelerate. North America still holds the largest absolute market share at ~48%, but Asia-Pacific growth rates consistently outpace the rest.
How much does SaaS waste cost enterprises?
SaaS waste costs the average enterprise $21 million per year. About 53% of SaaS licenses go completely unused — either because tools were purchased but never rolled out, or because employees stopped using apps without cancelling subscriptions. Only 26% of organizations actively use automated tools to track and reduce this waste.
What are the top SaaS security risks in 2026?
The biggest SaaS security risks include:
- Misconfigurations — responsible for up to 65% of organizational security problems
- Shadow IT — 69% of IT pros cite it as their top concern; ChatGPT now sits at #1 on shadow IT charts
- Insider threats — account for 22% of security incidents
- Former employee access — 31% of companies found ex-employees still had SaaS access
- Ransomware — targeting SaaS data at a 13% higher rate
What is the typical SaaS customer acquisition cost?
General B2B SaaS CAC ranges from $200 to $700. Enterprise sales CAC runs $4,000–$11,000 per customer. Fintech SaaS can exceed $6,000 per B2B customer. The median cost to acquire $1 in new ARR is $2 in sales and marketing spend — and CAC is rising 14% per year due to ad saturation and privacy changes.
How did SaaS valuations change after 2021?
SaaS valuations dropped sharply from their 2021 peak. Multiples corrected from roughly 15x ARR at the height of the zero-interest-rate era to approximately 6.6x ARR by 2026. Global VC investment in SaaS fell from $273.7B in 2021 to $116.7B in 2023 before recovering to $161.1B in 2024. AI-native SaaS companies continue to command premium multiples where strong defensibility can be demonstrated.
What share of the SaaS market does North America hold?
North America holds approximately 47.85% to 48% of the global SaaS market — the dominant region by a wide margin. The US market alone is projected at $211.7B by 2026, home to 12,400–17,000 SaaS companies and serving approximately 14 billion users worldwide.
What percentage of conversions happen on mobile for SaaS?
Mobile now drives 50.48% of all conversions — effectively equal to desktop at 49.52%. Mobile devices account for 58.67% of global web traffic. A 1-second delay in mobile page load time reduces conversions by 26%. By end of 2026, 50% of organizations plan to centralize SaaS management for mobile-first workflows.
What the SaaS Statistics Tell Us: Final Verdict for 2026
The SaaS industry is not in a bubble — it is in a consolidation phase that’s reshaping how software gets built, priced, and sold. The $466 billion market sits on top of genuine demand, not speculative hype. Every company on earth runs on SaaS, and that dependency only deepens as AI features get baked into every major platform.
The key tensions are clear: massive growth coexists with massive waste. Security risks are rising in step with adoption. CAC keeps climbing while churn benchmarks stay stubbornly persistent. The companies that win over the next five years will be the ones that solve real integration problems, build genuine NRR above 110%, and use AI to reduce operational friction rather than just add a chatbot to their marketing page.
✓ What the Numbers Confirm
- $466B market with a clear path to $1T+
- 42,000+ companies — the ecosystem is deep
- 80% enterprise AI deployment rate by year-end
- Vertical SaaS outgrowing horizontal platforms
- Mobile now drives half of all conversions
- VC recovery underway, focused on AI-native products
✗ What the Numbers Warn Against
- 53% of licenses go unused — waste is structural
- CAC rising 14% yearly, squeezing margins
- 65% of security problems tied to misconfigs
- Valuations compressed to 6.6x — no more easy exits
- Shadow IT and ex-employee access remain blind spots
- 39% of companies don’t practice agile planning
Need to Collect SaaS Market Data at Scale?
GeoNode gives you residential and datacenter proxies for competitive intelligence, pricing research, and SaaS market analysis — without blocks or rate limits.
Get Started with GeoNode Today →