
Instagram Statistics:
150+ Staggering Numbers That Expose a 3-Billion User Giant in 2026
Essential Instagram statistics for 2026: 3 billion monthly active users, $68B+ ad revenue, Reels driving 45% of engagement, and 130M shopping taps every month.
⚡ Instagram at a Glance: 2026 Key Statistics
Instagram has crossed 3 billion monthly active users as of 2025 — making it the second most-used social platform on earth after Facebook. From its start as a photo-sharing app in 2010, it now drives $68+ billion in annual ad revenue, hosts over 200 million business profiles, and processes more than 200 billion Reels plays every single day. If your marketing strategy doesn’t include Instagram data, you’re operating blind.
As of 2025; up from 1 billion in 2018
200M businesses active monthly
CPC: $0.20–$2.00 per click
Reels = 50% of time on platform
You’ve heard Instagram is big. But the Instagram statistics for 2026 reveal just how big — and more importantly, what the actual numbers tell you about where the platform is headed, who uses it, and whether your brand’s investment in it is justified.
The Instagram statistics for 2026 tell a story of a platform that has successfully navigated multiple format shifts — from photos to Stories to Reels — and emerged larger than ever. With 3 billion monthly active users, Instagram is now in a category shared only by Facebook and YouTube. It reaches 1.91 billion people through advertising, a figure that grew 13.1% in a single year.
For marketers, the numbers are equally striking. 90% of Instagram users follow at least one business. 130 million people tap on shopping posts every month. Influencer marketing on the platform is on track to surpass $22.2 billion by 2026. And Reels — the feature Meta bet the farm on to compete with TikTok — now accounts for 45% of all engagement on the platform.
This article compiles over 150 verified Instagram statistics drawn from multiple sources. Whether you’re a marketer building a strategy, a creator deciding where to focus your energy, or a researcher tracking platform trends, these data points give you the full picture.
Instagram Users & Growth Statistics
Instagram’s user base has grown from zero to 3 billion in just 15 years — a trajectory that few platforms have matched. Understanding how that growth unfolded, and where it is now, gives context to every other number in this article.
Instagram User Statistics 2026: Monthly Active Users
- 3 billion monthly active users (MAU) as of 2025 — making Instagram the world’s second most-used social platform and one of only three apps to reach this milestone (DemandSage, 2026)
- 500 million daily active users (DAU) — meaning roughly 1 in 6 Instagram accounts opens the app on any given day
- 3rd most popular app by active users globally, behind only Facebook and YouTube (Meltwater, 2026)
- Instagram is the 2nd favorite platform for 16.4% of active social media users, indicating deep loyalty beyond casual use
- Meta’s Family of Apps (Instagram, Facebook, WhatsApp, Messenger, Threads) reaches 3.58 billion daily active users combined — the largest daily audience in digital history
Instagram Monthly Active Users: Historical Growth 2016–2025
Instagram’s user trajectory is one of the most consistent growth stories in social media. It has never had a major contraction — only growth, even through competitive pressure from TikTok and Snapchat.
| Year | Monthly Active Users | Year-Over-Year Change |
|---|---|---|
| 2016 | 500 million | — |
| 2017 | 700 million | +40% |
| 2018 | 1 billion | +43% |
| 2019 | 1.1 billion | +10% |
| 2020 | 1.3 billion | +18% |
| 2021 | 2 billion | +54% |
| 2022 | 2.3 billion | +15% |
| 2023 | 2.4 billion | +4% |
| 2024 | 2.4 billion | 0% (plateau) |
| 2025 | 3 billion | +25% |
Source: DemandSage Instagram Statistics 2026; AffMaven Instagram Data 2026
Total Downloads & App Scale
- Instagram has been downloaded 3.8 billion times total since its 2010 launch — one of the most-downloaded apps in history (Meltwater, 2026)
- 95 million photos and videos are shared on Instagram every single day
- 98.1% of users access Instagram via mobile devices; only 1.9% use desktop exclusively (AffMaven, 2026)
- Instagram’s companion app Threads has reached 200 million monthly active users and 33 million daily active users — Threads became the fastest-growing consumer app ever, reaching 100 million users in just 5 days after launch
Most-Followed Accounts
| Account | Type | Followers |
|---|---|---|
| Platform (Brand) | 694.4 million | |
| @cristiano (Cristiano Ronaldo) | Athlete | 672 million |
| @leomessi (Lionel Messi) | Athlete | 511 million |
| @selenagomez | Celebrity | 415 million |
| @therock (Dwayne Johnson) | Celebrity | 390 million |
| @kyliejenner | Celebrity/Business | 390 million |
| @nike | Brand | 299.5 million |
Source: DemandSage 2026; Meltwater 2026. Note: follower counts fluctuate — these reflect mid-2025 data.
Most-Liked Posts of All Time
- Lionel Messi’s FIFA World Cup 2022 celebration post: 74.7 million likes — the most-liked photo in Instagram history (DemandSage, 2026)
- Chris Godfrey’s egg photo: 60.5 million likes
- Lionel Messi’s World Cup trophy photo: 53.7 million likes
Bot Accounts & Fake Followers
- 95 million bot accounts exist on Instagram, representing approximately 4.75% of all monthly active users (DemandSage, 2026)
- Fake followers and bot accounts cost marketers an estimated $1.3 billion per year in wasted influencer spend
- Approximately 15% of influencer followers are fake — a significant variable when evaluating influencer partnerships
What the growth data means for marketers: Instagram reaching 3 billion users is not just a vanity milestone. It signals that the platform has successfully diversified beyond its original 18–34 demographic into older age groups and new geographies, particularly in Asia-Pacific and South America. The ad reach growth of 13.1% year-over-year confirms this expansion is real and monetizable.
Instagram Users by Country & Region
Instagram’s user base is far from evenly distributed. India alone accounts for roughly 14% of all Instagram users — more than the entire United States. Understanding where users are concentrated shapes targeting decisions, content strategy, and ad spend allocation.
Top 10 Countries by Instagram Users
| Country | Instagram Users | % of Global MAU |
|---|---|---|
| India | 413.85 million | ~13.8% |
| United States | 171.7 million | ~5.7% |
| Brazil | 140.7 million | ~4.7% |
| Indonesia | 103.4 million | ~3.4% |
| Turkey | 58.45 million | ~1.9% |
| Japan | 57.45 million | ~1.9% |
| Mexico | 48.75 million | ~1.6% |
| United Kingdom | 33.4 million | ~1.1% |
| Germany | 31.25 million | ~1.0% |
| Argentina | 28.9 million | ~1.0% |
Source: DemandSage Instagram Statistics 2026
Regional Breakdown
- Asia-Pacific: 893 million users — the largest regional bloc, driven by India, Indonesia, and Japan (AffMaven, 2026)
- Europe: 338 million users — with Turkey, Germany, UK, and France as the leading markets
- Latin America: 299 million users — Brazil is the anchor, with Mexico and Argentina also significant
- North America: 224 million users — the highest-value advertising market despite being smaller by volume
- Southern Asia has the highest advertising reach at 27.3% of total Instagram ad reach — India dominates this figure (Meltwater, 2026)
- South America follows at 13.1% of advertising reach globally
US-Specific Stats
- 171.7 million Instagram users in the United States as of 2025 (DemandSage, 2026)
- 71% of US businesses use Instagram for marketing — one of the highest commercial adoption rates of any platform
- 63% of American users check Instagram at least once daily
- 42% of US users check the app multiple times per day
- US adults spend an average of 33.1 minutes per day on Instagram — up 3 minutes from the prior year
Advertising Reach by Geography
- Instagram’s estimated total advertising reach is 1.91 billion — meaning nearly two-thirds of all MAU can be targeted through ads (Meltwater, 2026)
- Ad reach grew 1.7% between July and October 2025 and 13.1% between 2024 and 2025 year-over-year
- Turkey has the highest ad reach potential relative to total population among major markets
Geography insight for advertisers: While India has the most Instagram users, US users generate dramatically higher revenue per ad impression. If you’re running campaigns with limited budget, targeting US and UK audiences typically delivers higher conversion value — even if the raw reach numbers appear smaller than Asia-Pacific targeting.
Instagram Demographics: Age, Gender & Generations
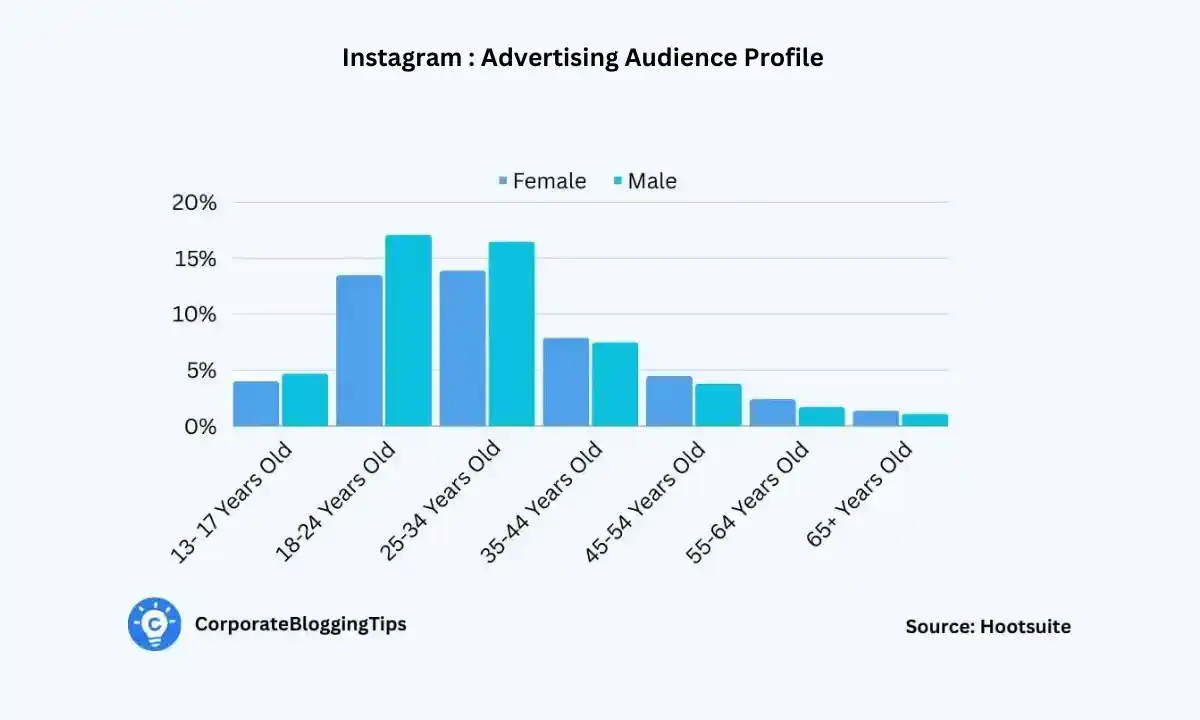
Who actually uses Instagram? The demographic breakdown reveals a platform dominated by younger adults globally, with meaningful variations between countries. These numbers directly affect everything from content tone to ad targeting decisions.
Global Age Demographics
| Age Group | % of Global Instagram Users |
|---|---|
| 18–24 | 31.7% |
| 25–34 | 30.6% |
| 35–44 | 16.4% |
| 45–54 | 9.0% |
| 55–64 | 4.8% |
| 65+ | 3.0% |
| 13–17 (under 18) | ~8% (estimated) |
Source: DemandSage 2026; AffMaven 2026
US Age Demographics
The United States shows a noticeably different age profile from the global average — older cohorts are better represented, reflecting the platform’s maturation in a market where it launched early.
| Age Group | % of US Instagram Users |
|---|---|
| 18–24 | 26.5% |
| 25–34 | 28.3% |
| 35–44 | 19.4% |
| 45–54 | 12.2% |
| 55–64 | 7.8% |
| 65+ | 5.8% |
Source: DemandSage 2026
Key Age Insights
- 62.3% of all global users are aged 18–34 — Instagram remains a platform dominated by younger adults, but not as dramatically as TikTok (DemandSage, 2026)
- The 18–24 cohort is the largest single age group globally at 31.7%
- In the US, the 35–44 age group represents 19.4% of users — significantly higher than the global average of 16.4%, confirming that US Instagram users skew older
- Users under 25 spend 32 minutes per day on Instagram; users over 25 spend 24 minutes per day (DemandSage, 2026)
- Instagram’s core user base per Meltwater is 16–34, with women in the 16–24 bracket showing the highest daily login rates — 69.4% log on at least once daily
Gender Demographics
- Global gender split: 52.5% male, 47.5% female (DemandSage, 2026) — a slight male lean globally
- US gender split: 55% female, 45% male — the US shows an inverted pattern compared to the global average (DemandSage, 2026)
- The global figure varies slightly by source: AffMaven reports 50.6% male / 49.4% female for January 2024, while DemandSage’s more recent data puts males at 52.5%
- Women aged 16–24 are the most daily-active user segment globally, with a 69.4% daily login rate (Meltwater, 2026)
Generational Usage & Teen Behavior
- Teens rank Instagram 4th most preferred social platform — behind YouTube, TikTok, and Snapchat (Meltwater, 2026)
- 26% of Gen Z and Millennials watch Instagram Live regularly
- Millennials and Gen Z combined represent the bulk of the 18–34 user bloc that makes up 62.3% of the platform
- 80% of Instagram users prefer watching Live video over reading a blog post — a behavioral signal with implications for content format
Demographic takeaway: Instagram is no longer a “young people only” platform. The 35–44 and 45–54 groups collectively represent 25.4% of US users. Brands that assume Instagram only reaches Gen Z are leaving a substantial, often higher-purchasing-power audience untargeted. Meanwhile, if your primary audience is teenagers, TikTok has a stronger position — Instagram ranks 4th among teens.
Instagram Engagement & Usage Statistics
Reach without engagement is just noise. The engagement and usage statistics below reveal how deeply people actually interact with content on Instagram — and which formats win the attention battle.
Time Spent on Instagram
- The global average time spent on Instagram is 31 minutes 40 seconds per day, or roughly 15 hours 50 minutes per month (DemandSage, 2026)
- Some reports from the Global Digital Report place average daily time higher — around 1 hour 13 minutes per day — though this figure includes passive background usage across devices
- US adults spend an average of 33.1 minutes per day on Instagram (2024), up 3 minutes year-over-year (AffMaven, 2026)
- Users under 25 average 32 min/day (equivalent to more than 8 full days per year spent on the app)
- Users over 25 average 24 min/day
Login Frequency & Daily Habits
- 500 million+ users open Instagram at least once per day
- 28% of total users log on multiple times per day (Meltwater, 2026)
- 21% log in on a weekly basis rather than daily
- 63% of American users check Instagram at least daily
- 42% of American users check the app multiple times each day
- 7 out of 10 people check Stories daily (DemandSage, 2026)
- 200 million+ accounts visit the Explore page daily (AffMaven, 2026)
- 50% of all accounts use Explore monthly
Instagram Engagement Statistics: Rates by Content Format
| Content Format | Avg Engagement Rate | Notes |
|---|---|---|
| Carousel Posts (businesses) | 3.55% | Highest engagement rate; 1.26% for all accounts |
| Reels | 1.23% avg; 3.79% (under 5K followers) | Highest reach rate (30.81%) |
| Video Posts | 2.21% | Higher than photo; lower reach than Reels |
| Photo Posts | 0.59%–2.69% | Wide range based on account size & niche |
| Business Account (overall) | 2.18% avg | Carousel outperforms all for businesses |
| Videos on Explore | 2x vs. photos | Video gets double the engagement on Explore feed |
Source: AffMaven 2026; Meltwater 2026
Hashtag Performance
- Posts with at least one hashtag see +29% more interactions for accounts under 1,000 followers (AffMaven, 2026)
- Using 11+ hashtags delivers +79.5% more interactions for small accounts
- Hashtags in captions generate +36% reach for accounts with fewer than 5,000 followers
- 7 out of 10 Instagram hashtags are branded — created and owned by companies rather than organic user tags
Instagram Live Statistics
- 100 million+ users tune in to Instagram Live daily
- 70% increase in Instagram Live usage occurred during the pandemic period — and engagement has remained elevated since
- 80% of Instagram users prefer watching Live video over reading a static blog post
- 26% of Gen Z and Millennials watch Instagram Live content regularly
Follower Distribution on Instagram
| Follower Range | % of Instagram Users |
|---|---|
| Under 1,000 | 26.43% |
| 1,000–10,000 | 49.94% |
| 10,000–50,000 | 15.21% |
| 50,000–100,000 | 3.15% |
| 100,000–500,000 | 3.9% |
| 500,000–1 million | 0.62% |
| 1 million+ | 0.76% |
Source: DemandSage 2026. The vast majority of accounts (76.37%) have fewer than 10,000 followers.
Engagement reality check: Only 9% of Instagram posts actually appear in followers’ feeds (down from 16% previously). The algorithm heavily prioritizes Reels, carousel content, and content that generates early engagement signals. If you’re posting standard photos and wondering why reach has dropped, the data above explains the problem — and the solution.
Instagram Stories Statistics
Instagram Stories launched in 2016 as a direct response to Snapchat. Ten years later, it has grown into a core content format used by 500 million people daily and central to brand marketing strategies worldwide.
Stories Scale & Daily Usage
- 500 million accounts use Instagram Stories every single day (AffMaven, 2026)
- 7 out of 10 people check Stories daily (DemandSage, 2026)
- 9 in 10 users post Stories daily, making it the most actively used creation feature on the platform
- 1 in 3 of the most-viewed Stories come from business accounts — brands are the power users here
Stories Completion & Retention
- 86% of branded Stories are watched to completion (AffMaven, 2026) — a remarkably high completion rate compared to other video formats
- Average reach of Stories: 0.91 users per follower — meaning Stories reach about 91% of your followers who are active (Meltwater, 2026)
- More Story frames = lower retention rate; Meltwater recommends posting 1–7 Stories per day for the best completion rate
- The top 25% of brands see an average tap-back rate of around 6.5%
Brand Usage of Stories
- 71.9% of brand content on Instagram appears through Stories — it is the dominant brand content format, surpassing feed posts (Meltwater, 2026)
- Brands publish an average of 10 Stories per month; active brands post 17 per month (DemandSage, 2026; Meltwater, 2026)
- Accounts posting 3+ times per week achieve the best engagement rates on Stories and feed posts combined
- 44% of social users wish brands would post to Instagram more frequently
Audience Response to Stories
- 58% of users become more interested in a brand after seeing it featured in Stories (AffMaven, 2026)
- 62% of users say they’re more interested in a brand after viewing Stories content — the exact figure varies slightly by source but the direction is consistent (DemandSage, 2026)
- 67% of users have “swiped up” on a branded Stories link — the swipe-up CTA converts (AffMaven, 2026)
- Stories with location tags get 79% more views on average (AffMaven, 2026)
Influencer Use of Stories
- 55.4% of influencers use Stories for sponsored posts (Meltwater, 2026) — making it the second most common format for influencer content after feed posts
Stories bottom line: If your brand is not posting Stories, you’re invisible to a significant portion of your audience. Stories drive the highest organic reach relative to follower count (0.91 users per follower), outperform feed posts for brand awareness, and deliver a swipe-up conversion rate that rivals dedicated landing page traffic. The data consistently shows that Stories are underused by brands — only 10–17 per month when daily posting would be more effective.
Instagram Reels Statistics
Reels is now the most important content format on Instagram. Meta’s bet on short-form video to compete with TikTok paid off — Reels drives more reach, more engagement, and more time on platform than any other content type.
Instagram Reels Statistics: Scale & Daily Plays
- Over 200 billion Reels are played every day across Instagram and Facebook combined (Meltwater, 2026; DemandSage, 2026)
- Reels account for 50% of all time spent on Instagram — the single format consuming half the platform’s total attention (DemandSage, 2026)
- 1 in 2 marketers now use Instagram Reels as their primary influencer marketing format
Instagram Reels Engagement Performance
- Reels have a 22% higher chance of engaging users compared to standard video posts (DemandSage, 2026)
- Average reach rate of Instagram Reels: 30.81% — meaning the average Reel reaches about 31% of an account’s followers, far exceeding other content types (DemandSage, 2026)
- Reels account for 45% of total Instagram engagement across all content types (Meltwater, 2026)
- Business accounts have an average 0.45% engagement rate specifically on Reels content
Reels Reach by Follower Count
| Follower Count | 2022 Avg Reach | 2023 Avg Reach | Trend |
|---|---|---|---|
| 50K–45M followers | 95,600 | 47,851 | -50% (more competition) |
| 10K–50K followers | 16,800 | 6,243 | -63% |
| 2K–10K followers | 3,400 | 1,726 | -49% |
Source: DemandSage 2026. Reach numbers are declining as more Reels compete for the same algorithmic slots — but Reels still outperform all other formats in absolute reach.
Reels Production & Posting Patterns
- Accounts with 50K+ followers post approximately one Reel every two days — a high-frequency strategy that the algorithm rewards (Meltwater, 2026)
- Best time to post Reels: Saturdays, 10 PM – 7 AM (Meltwater, 2026)
- Only Reels under 3 minutes will be recommended to non-followers — longer Reels are only shown to existing followers
- In December 2024, Instagram added the “Trial Reel” feature — allowing creators to test Reels with a non-follower audience before publishing to their main feed
- Reels ads have a 60-second length limit
Reels verdict: No other single content change will improve your Instagram reach more than shifting to Reels. The 30.81% reach rate versus 0.91% for Stories (per follower) shows a clear platform-level algorithmic preference. If you’re not producing at least 3–4 Reels per week, you are competing at a disadvantage against every account that is.
Instagram for Business Statistics
Instagram has become one of the primary commercial channels on the internet. The statistics below show how deeply commerce has been woven into the platform’s DNA — and why businesses that ignore it are leaving significant revenue on the table.
Business Profile Scale
- 200 million+ business profiles are active on Instagram monthly (Meltwater, 2026)
- 71% of US businesses use Instagram as part of their marketing strategy
- Instagram is the 2nd most popular platform for brand and product research, after only Facebook (Meltwater, 2026)
- The education sector has the highest business engagement rate on Instagram compared to other industries
How Users Interact with Businesses
- 90% of Instagram users follow at least one business account (DemandSage, 2026; AffMaven, 2026)
- 62.8% of Instagram users actively follow at least one brand (Meltwater, 2026)
- 50% of users use Instagram to discover new businesses — the platform functions as a discovery engine (DemandSage, 2026)
- 50% of Instagram users engage with brands regularly (Meltwater, 2026)
- 81% of users research products and services on Instagram before purchasing (AffMaven, 2026)
- 2 in 3 users say Instagram enables meaningful interaction with brands they care about
- 44% of users rely on Instagram for product reviews and recommendations (Meltwater, 2026)
Direct Messages & Purchase Intent
- 44% of Instagram users use Direct Messages at least once per week — often to communicate directly with brands about products (AffMaven, 2026)
- 44% of users shop on Instagram weekly (DemandSage, 2026)
- 77% of businesses use retargeting on Instagram — leveraging the platform’s pixel and custom audience capabilities (DemandSage, 2026)
Best Posting Times for Business Accounts
- Monday: 6 AM, 10 AM, 10 PM (peak engagement: 11 AM–2 PM)
- Wednesday: 7–9 AM (peak: 11 AM–1 PM)
- Sunday: Lowest user involvement across all account types
- Mid-week morning posts consistently outperform weekend posts for business accounts
Business stat that matters most: 81% of users research products on Instagram before buying. That means your Instagram profile is not just a brand awareness tool — it is an active part of the purchase consideration process. Profile optimization, product tagging, and responsive DMs directly influence conversion, not just follower counts. For brands that pair Instagram with a content strategy, the results compound — see how in our blogging statistics guide.
Instagram Influencer Marketing Statistics
Instagram remains the leading platform for influencer marketing, despite TikTok’s rise. The data shows a maturing industry with clear tier structures, measurable ROI, and continued advertiser preference for Instagram over competing platforms.
Instagram Influencer Statistics: Market Scale
- 500,000+ active influencers operate on Instagram (DemandSage, 2026; Meltwater, 2026)
- 72% of marketers use Instagram for influencer marketing — more than any other platform (Meltwater, 2026)
- 80.8% of marketers plan to use Instagram for influencer programs in 2024 and beyond (AffMaven, 2026)
- Over half of marketers still prefer Instagram over TikTok for influencer marketing programs (Meltwater, 2026)
- Marketers collectively spend $8 billion per year on Instagram influencers (Meltwater, 2026)
- The global influencer marketing industry is projected to surpass $22.2 billion by 2026 (AffMaven, 2026)
Influencer Tier Breakdown
| Tier | Follower Range | % of All Influencers | Avg Engagement Rate |
|---|---|---|---|
| Nano-Influencers | 1,000–10,000 | 65.39% | 5.6% (highest) |
| Micro-Influencers | 10,000–50,000 | 27.73% | 2–4% |
| Macro-Influencers | 100,000–500,000 | ~3.9% | 1–2% |
| Mega-Influencers | 1 million+ | 0.76% | Under 1% |
Source: AffMaven 2026; DemandSage 2026
Influencer Pricing
| Influencer Size | Followers | Avg Cost Per Post |
|---|---|---|
| Nano | Under 10,000 | $80–$90/post |
| Micro | Under 100,000 | ~$200/post |
| Mid-tier | 250,000–500,000 | ~$670/post |
| Mega | 1 million+ | ~$1,900/post |
| Sponsored Post (avg all tiers) | All sizes | $418 (up 15.17% from 2023) |
Source: DemandSage 2026; AffMaven 2026
Influencer ROI & Effectiveness
- Instagram influencer marketing delivers an average $4.12 earned media value per $1 spent — a strong ROI by any channel comparison (AffMaven, 2026)
- 87% of people say an influencer influenced them to purchase a product (DemandSage, 2026)
- 37% of Instagram users interact with influencers on a regular basis (Meltwater, 2026)
- 78%+ of influencers prefer Instagram for branded partnerships, indicating platform-side preference too (Meltwater, 2026)
- Micro-influencers are currently seeing a -3% drop in engagement as competition in the mid-tier space increases (Meltwater, 2026)
Influencer Demographics & Niches
- 77% of Instagram influencers are female (AffMaven, 2026)
- 14.32% of Instagram influencers identify as lifestyle influencers — the largest single niche category (DemandSage, 2026)
- Fashion accounts for 25% of all sponsored posts on Instagram (AffMaven, 2026)
- 1 in 2 marketers use Instagram Reels specifically for influencer marketing campaigns
The nano-influencer case: With 65.39% of all influencers in the nano tier and a 5.6% average engagement rate (versus under 1% for mega-influencers), the data strongly supports nano-influencer strategies for targeted campaigns. A budget of $5,000 can reach 55+ nano-influencers versus a single mid-tier at $670/post — and the nano approach often generates more authentic engagement and better conversion rates in niche markets. Marketers who manage multiple accounts at scale often pair this with dedicated social media proxies to keep operations compliant and uninterrupted.
Instagram Advertising Statistics
Instagram’s advertising platform is one of Meta’s most profitable products — and for advertisers, it delivers one of the largest targetable audiences on earth. These numbers define what Instagram advertising looks like at scale in 2025.
Instagram Advertising Statistics: Ad Revenue Growth
- Instagram’s projected ad revenue for 2025 is $68+ billion (Meltwater, 2026)
- Instagram ad revenue reached $59.6 billion in 2024, up from $50.58 billion in 2023 — a 17.8% year-over-year increase (AffMaven, 2026)
- Ad costs increased approximately 23% year-over-year, reflecting growing advertiser demand (AffMaven, 2026)
Instagram Monthly Active Users Reachable via Ads
- Estimated advertising reach: 1.91 billion users — meaning nearly two-thirds of all Instagram users can be targeted through paid advertising (Meltwater, 2026)
- Advertising reach grew 13.1% between 2024 and 2025, and a further 1.7% between July and October 2025 alone
- Instagram is among the top 3 platforms globally by total addressable advertising audience
Ad Costs & Performance
- Cost-per-click (CPC): $0.20–$2.00 depending on industry, audience, and ad format (Meltwater, 2026)
- Average conversion rate: 1–2% for Instagram ads (Meltwater, 2026)
- Only 4% of US users opted into ad tracking following iOS 14.5 (AffMaven, 2026) — a significant challenge for pixel-based retargeting campaigns
- 26% of users strongly dislike too many ads — frequency capping is important to avoid negative brand association
Available Ad Formats
- Instagram currently supports 7 primary ad formats: Stories Ads, Image Ads, Video Ads, Carousel Ads, Collection Ads, Explore Ads, and Shopping Ads
- Reels Ads have a maximum length of 60 seconds
- Carousel Ads consistently deliver the highest engagement rate for business accounts at 3.55%
Social Media Ad Comparison
| Platform | Monthly Active Users | Ad Reach | Avg CPC |
|---|---|---|---|
| 3.07 billion | Largest | $0.30–$1.50 | |
| 3 billion | 1.91 billion | $0.20–$2.00 | |
| YouTube | 2.58 billion | Large | $0.10–$0.30 (CPV) |
| TikTok | 1.99 billion | Growing | $0.50–$1.00 |
Source: DemandSage 2026; Meltwater 2026. CPC figures are approximate ranges and vary significantly by industry and targeting.
iOS 14.5 impact: The 4% opt-in rate for ad tracking in the US has meaningfully reduced the precision of Instagram retargeting campaigns. Advertisers have adapted by leaning on broader audience targeting, first-party data uploads, and content-based targeting rather than pure behavioral tracking. If your campaigns haven’t been restructured post-iOS 14.5, performance data may be misleading due to underreported conversions.
Instagram Shopping Statistics
Social commerce on Instagram has moved from a test feature to a core revenue driver for brands. With 130 million shopping taps per month and weekly shopping behavior from 44% of users, Instagram has become a genuine purchase channel — not just an inspiration board.
Shopping Behavior at Scale
- 130 million users tap on shopping posts every month — an enormous volume of purchase intent signals (AffMaven, 2026)
- 70% of shoppers look to Instagram to discover their next purchase (AffMaven, 2026)
- 44% of Instagram users shop on the platform weekly (DemandSage, 2026)
- 50% of users have visited a website to buy a product after seeing it on Instagram
- Product tagging in posts can drive 37% more sales compared to posts without product tags (AffMaven, 2026)
Product Discovery & Research
- 81% of users research products on Instagram before making a purchase decision
- 44% of users rely on Instagram for product reviews and recommendations — rivaling dedicated review platforms for certain categories (Meltwater, 2026)
- 58% of users become more interested in brands after seeing their products in Stories (AffMaven, 2026)
- Instagram is classified as the 2nd most important platform for brand/product research globally after Facebook (Meltwater, 2026)
Explore Page & Discovery
- 200 million accounts visit the Instagram Explore page daily — making it a high-traffic discovery surface for new brands (AffMaven, 2026)
- 50% of all Instagram accounts use Explore monthly
- Posts with location tags get 79% more views on Explore — geo-tagging is a simple, underused tactic for small businesses
- Videos on Explore generate 2x the engagement of photos on the same surface
Social Commerce Growth Context
- Social commerce as a category is growing significantly year-over-year, with Instagram at the center of this shift for visual product categories: fashion, beauty, home, and food
- Pizza is the most Instagrammed food globally — a data point that illustrates how food commerce and Instagram discovery intersect
- Instagram Shopping features (product stickers, shoppable posts, Shop tab) lower the friction between content discovery and purchase completion
Shopping bottom line: Instagram has completed the transformation from photo-sharing app to purchase platform. The 130 million monthly shopping taps are not passive browsing — they represent active purchase intent. Brands that haven’t set up Instagram Shopping features, product tags, and Explore optimization are missing a channel that is already driving significant revenue for competitors in the same space.
Instagram Statistics: Frequently Asked Questions
How many monthly active users does Instagram have in 2026?
Instagram has 3 billion monthly active users as of 2025, making it the second most-used social platform on earth. This represents a dramatic jump from 2.4 billion in 2023–2024, driven by growth in Asia-Pacific markets and continued expansion in Latin America. The platform also has approximately 500 million daily active users. These Instagram statistics confirm the platform’s continued dominance despite competition from TikTok and Snapchat.
Which country has the most Instagram users?
India leads with 413.85 million Instagram users — more than double the United States at 171.7 million. The full top 5: India (413.85M), United States (171.7M), Brazil (140.7M), Indonesia (103.4M), and Turkey (58.45M). India’s dominance reflects massive smartphone adoption and a young, digital-native population. However, the US generates higher ad revenue per user due to stronger purchasing power and advertiser demand.
What age group uses Instagram the most?
The 18–24 age group is the largest single cohort at 31.7% of global users. When combined with the 25–34 group (30.6%), the 18–34 bracket makes up 62.3% of all global Instagram users. In the US, the distribution is slightly older — 35–44 year-olds represent 19.4% of US users, compared to 16.4% globally. Women aged 16–24 have the highest daily login rate at 69.4%.
How many businesses are on Instagram?
There are 200 million+ business profiles active on Instagram monthly. Additionally, 71% of US businesses use Instagram for marketing. The commercial ecosystem is deeply embedded: 90% of users follow at least one business account, 81% research products on the platform, and 44% shop weekly. Instagram is now firmly the second most important platform for product research globally, behind only Facebook.
What is the engagement rate on Instagram Reels?
Reels have an average reach rate of 30.81% — meaning the average Reel reaches about 31% of an account’s followers. This far exceeds other content types. In terms of engagement rate, Reels average 1.23% overall, but accounts with fewer than 5,000 followers see up to 3.79%. Reels also have a 22% higher chance of engaging users compared to standard video posts, and account for 45% of all Instagram engagement. The 200 billion daily plays figure confirms Reels as the dominant content format on the platform.
How much does Instagram advertising cost?
Instagram’s cost-per-click ranges from $0.20 to $2.00 depending on industry, audience size, ad format, and competition. The average conversion rate for Instagram ads is 1–2%. Total Instagram ad revenue for 2024 was $59.6 billion, with 2025 projected at $68+ billion. Ad costs have increased approximately 23% year-over-year, reflecting advertiser demand growth outpacing supply. Carousel ads tend to deliver the highest engagement value for business advertisers at 3.55% engagement.
How many influencers are on Instagram?
There are 500,000+ active influencers on Instagram. The tier breakdown: nano-influencers (1K–10K followers) make up 65.39% of all influencers; micro-influencers (10K–50K) account for 27.73%. Nano-influencers have the highest engagement rate at 5.6%. Influencer post pricing ranges from $80–$90 for nano-influencers to $1,900+ for those with 1 million+ followers. The Instagram influencer market is projected to exceed $22.2 billion by 2026, and 72% of marketers use Instagram specifically for influencer programs.
How many people use Instagram Stories daily?
500 million accounts use Instagram Stories every day. Seven out of ten users check Stories daily. Stories deliver an average reach of 0.91 users per follower — effectively reaching 91% of your active followers. Brand Stories complete at an 86% rate. Location-tagged Stories receive 79% more views. Despite this, most brands post only 10 Stories per month; active brands average 17. The format is widely underused relative to its reach performance.
How much time do people spend on Instagram per day?
The global average is 31 minutes 40 seconds per day, per Data Reportal, amounting to roughly 15 hours 50 minutes per month. US adults spend 33.1 minutes per day. Users under 25 spend 32 minutes daily (equivalent to over 8 full days per year on Instagram). Users over 25 average 24 minutes daily. Some global reports measure higher at around 1 hour 13 minutes when including background/passive usage across connected devices.
How many shopping taps happen on Instagram per month?
130 million users tap on shopping posts every month. Seventy percent of shoppers use Instagram to discover their next purchase. Product tagging can drive 37% more sales per post. These Instagram shopping statistics represent active purchase intent, not just passive scrolling — making the platform a genuine conversion channel for visual product categories like fashion, beauty, and home goods.
Is Instagram growing or declining?
Instagram is growing. The platform reached 3 billion monthly active users in 2025, up from 2.4 billion in 2023–2024. Advertising reach grew 13.1% between 2024 and 2025. Ad revenue grew from $50.58 billion (2023) to $59.6 billion (2024) with $68+ billion projected for 2025. The one area of caution: Reels reach per account has declined as more content competes for algorithmic placement — but the platform’s overall user and revenue trajectory remains strongly positive.
How do Instagram statistics compare to TikTok?
Instagram has 3 billion MAU versus TikTok’s 1.99 billion — a 50% larger user base. Over half of marketers still prefer Instagram over TikTok for influencer programs. Instagram generates significantly more ad revenue ($59.6B in 2024 vs. TikTok’s estimated $18B). However, TikTok is teens’ preferred platform (teens rank Instagram 4th, behind YouTube, TikTok, and Snapchat). For engagement among younger demographics, TikTok remains the stronger platform. For overall reach, commerce, and business marketing, Instagram leads.
What These Instagram Statistics Tell Us: Final Verdict
After reviewing 150+ Instagram statistics across user growth, demographics, engagement, advertising, influencer marketing, and shopping, the picture is consistent: Instagram is not just surviving the short-form video era — it is winning it.
The jump to 3 billion monthly active users in 2025 is not organic demographic growth alone. It reflects a deliberate and successful platform evolution: Stories added daily engagement habits, Reels captured time-on-platform (now 50% of all time spent), and Shopping connected discovery to purchase in a single session. The $68+ billion in projected 2025 ad revenue proves advertisers agree.
For marketers, the Instagram statistics point clearly in one direction: Reels are now the primary format (30.81% reach rate vs. 0.91% per follower for Stories), nano-influencers deliver the highest engagement per dollar spent, and shopping integration turns content into commerce. The brands winning on Instagram in 2026 are those treating it as a full-funnel channel — not just an awareness play.
✓ What the Instagram Stats Confirm
- Reels are the dominant format — 45% of all engagement, 30.81% reach rate
- Stories reach 91% of active followers per post
- 130M shopping taps monthly — Instagram is a purchase channel
- Nano-influencers deliver 5.6% engagement at $80–$90/post
- 72% of marketers use Instagram for influencer campaigns
- Ad reach of 1.91 billion — growing 13.1% year-over-year
- 90% of users follow at least one business account
- Carousel posts: 3.55% engagement — highest for business content
- Hashtag usage boosts interactions 29–79% for small accounts
✗ Where Instagram Has Real Limitations
- Only 9% of feed posts reach followers (vs. 16% previously)
- 95 million bot accounts distort influencer metrics
- Teens rank Instagram 4th — behind YouTube, TikTok, Snapchat
- iOS 14.5: only 4% of US users opted in to ad tracking
- Reels reach per account has declined 49–63% since 2022 as competition grows
- 26% of users dislike seeing too many ads — frequency matters
- Ad costs up 23% YoY — ROI benchmarks need to adjust
Ready to Act on These Instagram Statistics?
Every serious Instagram strategy needs a destination. Hostinger gives you fast, reliable hosting to build the landing pages, product stores, and brand websites that turn Instagram followers into customers.
Build Your Website with Hostinger →