
Server monitoring is a process whereby all the system resources associated with the server are monitored to understand resource usage patterns and optimize them accordingly. Server health is essential to keeping your web server optimized and giving the best performance. A server monitoring tool ensures that the server can host the applications, and many server monitoring tools are available for this job.
Here, we will reveal the top 10 server monitoring tools to help your system run smoothly and ensure optimum resource utilization.
What is a Server Monitoring Tool?
A server monitoring tool analyses the processes and performance of your web server and gives you a graphical presentation and data analytics. This visual presentation and data represent how your server is performing. What processes use the maximum resources, and when you need to scale up the resources on your virtual machines.
It analyses important metrics:
- CPU Usage / CPU utilization
- RAM(Memory) Consumption
- I/O
- Network Usage
- Top Processes
- Disk Usage
- etc
Types of Server Monitoring Tools
You need to monitor a specific part of your server based on your needs and role. There are different types of tools available for monitoring server health.
- Uptime monitoring tools
- Error monitoring tools
- Performance monitoring tools
- Resources monitoring
- Database monitoring tools
- Security analysis tools
- Infrastructure monitoring tool
Best Server Monitoring Tools

Many tools are available in the market, but it would not be justified to mention every tool on the list. We have checked the efficiency and compiled this list based on the user reviews. So, let us check our list of top 10 server monitoring tools, starting from the most preferred ones.
Grafana
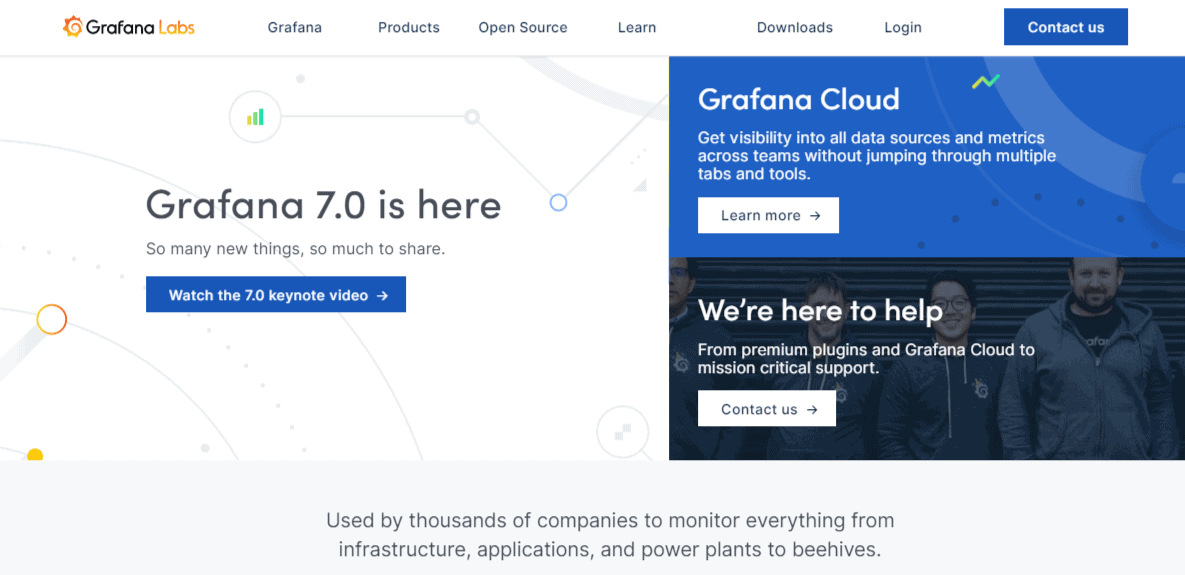
Grafana is a multi-platform, open-source analytics and interactive visualization tool available since 2014. It offers a wide range of charts, graphs, and alerts for the web when connected to support data sources. Not only this, but Grafana is also easily expandable through a plugin system.
Tech developers can create endless complex monitoring dashboards using interactive query builders. It is one of the best server monitoring tools often used with time series databases such as Prometheus Graphite and monitoring platforms such as Sensu, Netdata, and PRTG. The best part is that you can install the package on your cloud server and use it to monitor the server’s performance.
nagios xi
Nagios xi is another powerful monitoring tool under active development for many years. Nagios xi has been written in C language, which extends your area of operation and allows you to do almost anything that a system and network administrator might need from the application package for monitoring purposes.
Though the configuration of Nagios is highly complex and can be a problem for beginners, it’s a significant advantage at the same time because this feature enables it to accomplish any task of monitoring. The web interface is fast and intuitive, and the server is highly reliable. Nagios allows one to continuously monitor the status of servers, services, network channels, and everything else that the IP network layer protocol understands.
New Relic
New Relic is a free web-based server monitoring system that can be installed on your physical and virtual servers. With outstanding monitoring capabilities, New Relic analyzes the disk space, server health, the errors in your server stack, and a lot more. The features include serverless monitoring, APM, infrastructure monitoring, etc.
The free version will collect data about your server’s performance, stack uptime, disk space, usage, etc. New Relic works seamlessly whether you have a Linux cloud server or a Windows server deployed for your applications.
Cacti
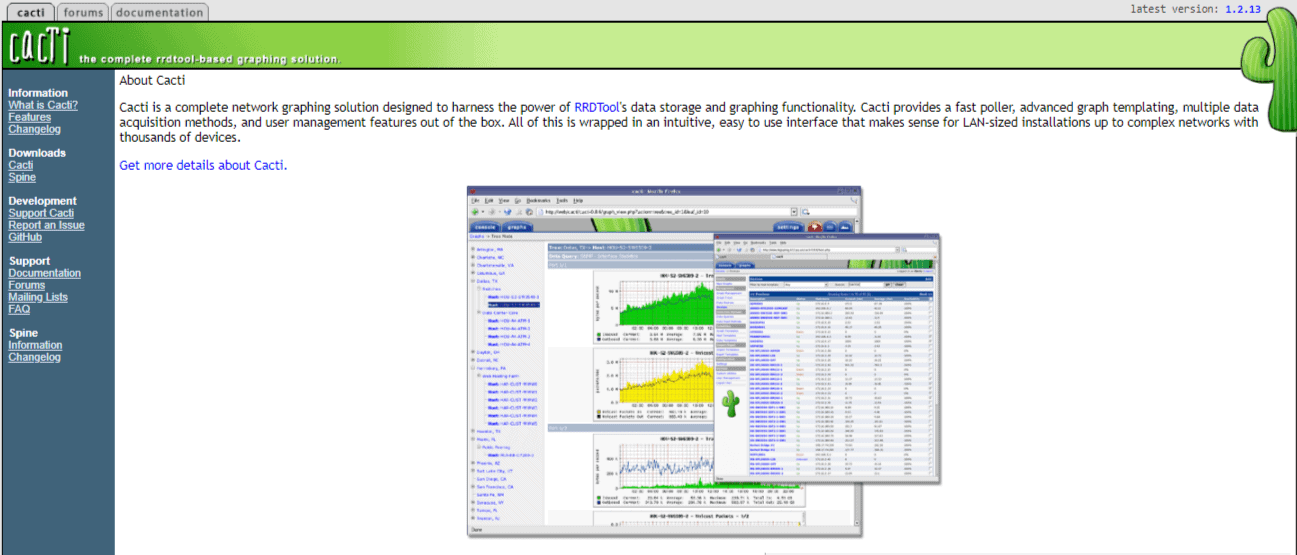
Cacti is a cloud server monitoring tool, free to download and included in the LAMP suite, which provides a standardized tool platform for building graphs based on any statistical data.
Cacti has proven to be such a monitoring toolkit with extensive capabilities for graphical display and analysis of network performance trends that can be used to monitor almost any monitored metric represented in the graphic format.
Icinga
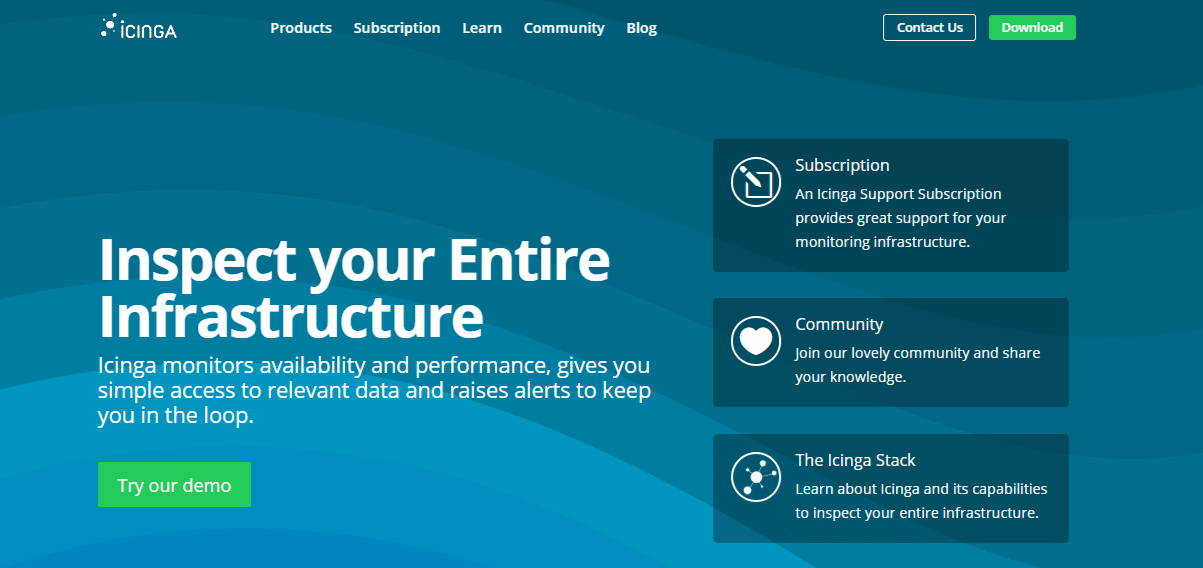
Icinga is another favored open-source network monitoring tool. Previously, this used to be part of Nagios, but recently, it was rewritten into a stand-alone solution known as Icinga 2. Icinga is a server monitoring tool and alerting platform as open and extensible as Nagios.
The difference lies in the configuration process of these two. Icinga can be configured via a web interface. It integrates many tools for monitoring, such as PNP4 Nagios, inGraph, and Graphite, which ultimately provides you with a positive visualization of your network.
Zabbix

Zabbix is an all-in-one network and system monitoring tool package combined in one web console. It can be configured to collect and monitor data from various servers and network devices.
Zabbix enables you to monitor servers and networks with a wide range of tools, including virtualization, hypervisors, and web stacks. Zabbix allows you to customize the dashboard and web interface to focus on a network’s most important components.
Observium
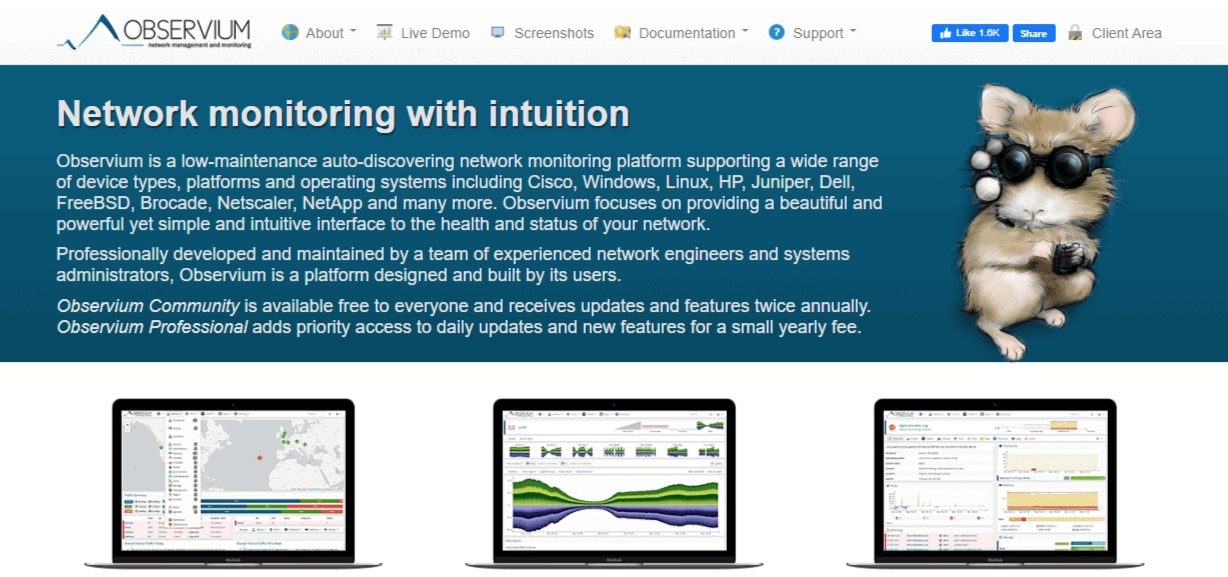
It is another major monitoring network equipment and server with a massive list of supported devices using the SNMP protocol. Easy installation and configuration are its USPs. It is installed as its own server with a dedicated URL. Observium can explore surrounding networks and collect data for each detected system. Observium can also see network devices via CDP, LLDP, or FDP.
An amicable user interface with advanced capabilities for the statistical display of data through graphs and diagrams are the unique features that make it demanding in the market.
PRTG

The Paessler PRTG network monitoring tool is an integrated solution for small and enterprise environments. PRTG is more than just a server monitor because it can monitor IT-related resources that connect to your network. The application can track everything that you want to know about your server.
Server Density
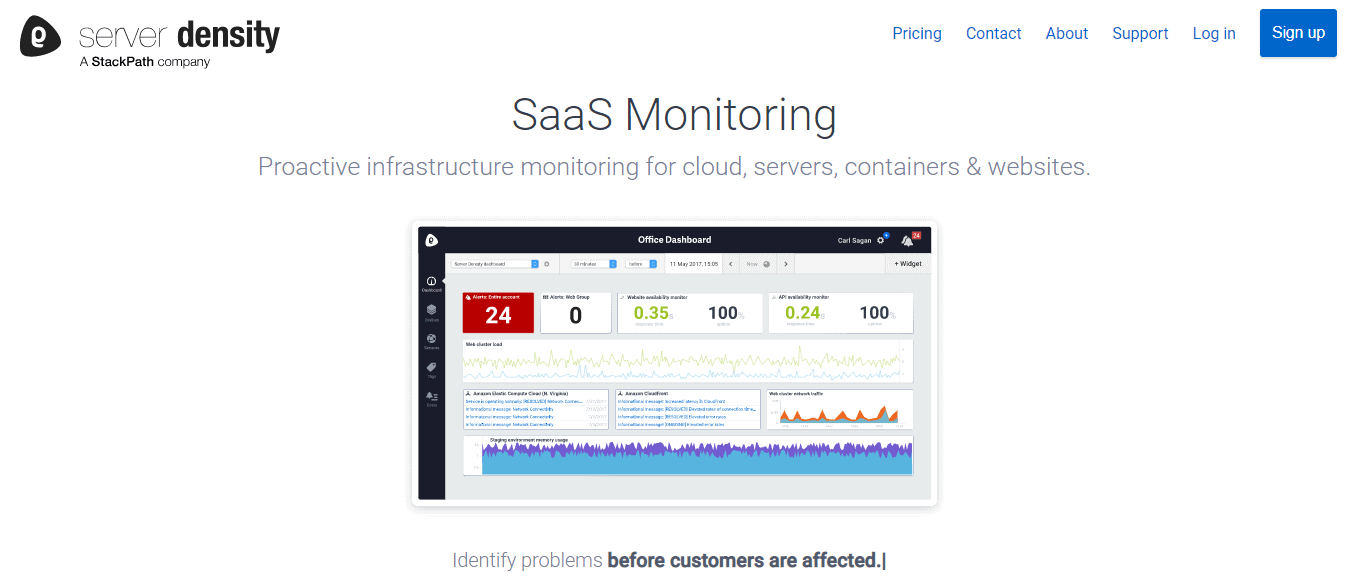
This tool monitors onsite and cloud-based servers. It covers Linux and Windows onsite servers and AWS or Azure-based cloud servers. Server density is an amicable user interface that helps you get all the information regarding your resources. The not-so-complex configuration makes it easier for beginners, which is why it is a fantastic monitoring tool.
Instrumental
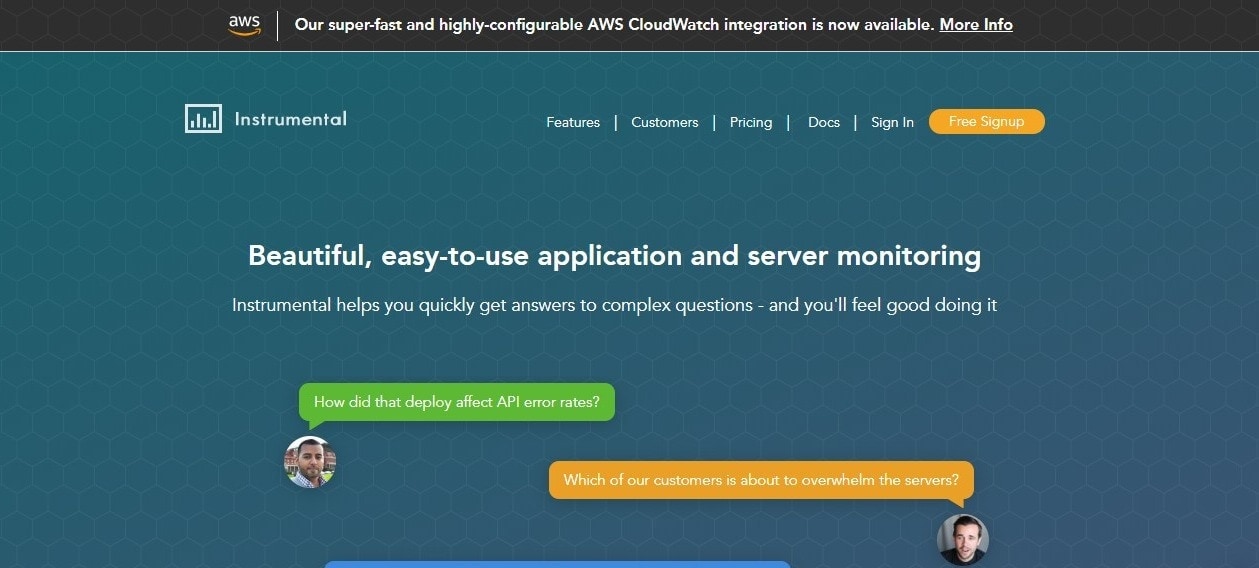
Instrumental is an application monitor that covers server statuses, specifically CPU usage, disk status, load information, memory activity, network interaction, and page-swapping events. Instrument enables the process of monitoring servers very smoothly and efficiently.
Anturis
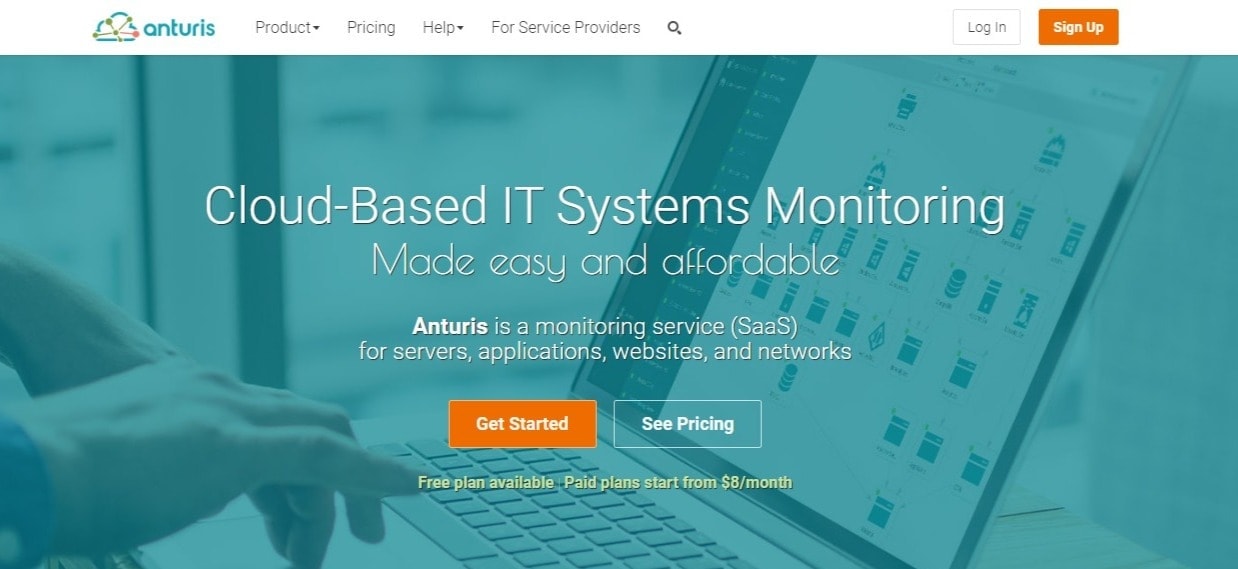
As a cloud-based server monitor, it tracks CPU, memory, disk usage, page swaps, power supply status, fan status, and temperature. Anturis offers a wide range of features that make monitoring servers exciting and secure.
Conclusion – Best Server Monitoring Tool
With the above-mentioned tools, we finally conclude our list for optimizing resources.
Server tools have become famous as logging in to each server individually and manually checking performance is time-consuming. These are the top 10 server monitoring tools that provide a wide range of features for the smooth running of your system.