
YouTube Statistics:
150+ Staggering Numbers Behind the World’s Biggest Video Platform in 2026
150+ verified YouTube statistics for 2026 covering 2.58B monthly users, $60B revenue, creator earnings, Shorts growth, and full demographic breakdowns.
⚡ YouTube at a Glance: Key Statistics for 2026
YouTube is not just a video platform — it is the second most visited website on earth, a dominant search engine in its own right, and a $60 billion annual business. Whether you are a marketer, creator, business owner, or researcher, these YouTube statistics show exactly where the platform stands, how fast it is growing, and what it means for anyone building an audience online.
150+ data points across all major categories
Audience research, ad planning, benchmarking
Monthly active users as of 2026
Data sourced from DemandSage & Backlinko 2026
You already know YouTube is big. But the full picture of YouTube statistics reveals something far more striking. YouTube processes more searches per day than Bing, Yahoo, and every other search engine combined — except Google. It reaches more 18–49 year-olds in the United States than any broadcast or cable TV network. And it generated more revenue in the first half of 2025 alone ($18.72 billion) than most Fortune 500 companies make in a full year.
For marketers, the YouTube statistics in 2026 reveal an advertising platform that keeps growing even as other social media ad markets plateau. With 2.58 billion YouTube monthly active users, advertising reach is simply unmatched. For creators, they reveal a monetization engine where the top channels generate hundreds of millions of subscribers — and even mid-tier creators can build viable full-time incomes. For researchers and strategists, these numbers show how deeply YouTube has embedded itself into daily human behavior across every age group, income bracket, and geography.
This article compiles over 150 verified YouTube statistics drawn from multiple research sources. The data covers users and growth, geography, demographics, engagement, content output, revenue, the creator economy, advertising, and competitive positioning. Every number is current as of May 2026, with historical trend data included wherever it helps show the direction of travel.
Whether you are planning a YouTube content strategy, allocating an ad budget, studying the creator economy, or simply trying to understand where the platform is headed — these statistics give you the full picture.
YouTube User Statistics & Growth: 2026 Data
YouTube’s user base has grown from 20 million visitors in 2006 to 2.58 billion monthly active users in 2026. That trajectory — from startup to global utility — took less than 20 years and shows no sign of reversing. Here is the complete picture of where user numbers stand today and how they got there.
Current User Base (2026)
- 2.58 billion monthly active users (MAU) as of 2026 — making YouTube the 4th largest social media platform by active user count
- 122 million daily active users (DAU) visit the platform each day — approximately 5% of monthly users (roughly 1 in 21) open YouTube on any given day
- 42.8% of all global internet users access YouTube at least once per month
- ~46% of internet users visit YouTube at least once a month — almost half the global online population
- YouTube is the #2 most visited website globally after Google.com, with 28.39 billion visits recorded in April 2026 alone
- The YouTube mobile app has been downloaded 10 billion+ times on Google Play Store — one of the most-installed apps in Android history
Historical User Growth (2006–2026)
| Year | Active Users | Milestone |
|---|---|---|
| 2006 | 20 million | Google acquires YouTube for $1.65B |
| 2008 | 160 million | 8x growth in 2 years post-acquisition |
| 2012 | 800 million | Mobile viewership begins to accelerate |
| 2013 | 1 billion | First billion-user milestone |
| 2014 | 1.3 billion | YouTube Red (now Premium) announced |
| 2019 | 2 billion | Second billion-user milestone |
| 2020 | 2.3 billion | Pandemic drives massive viewership spike |
| 2021 | 2.5 billion | YouTube Shorts launches globally |
| 2022 | 2.52–2.68 billion | Shorts reaches 1.5B monthly users |
| 2023 | 2.53–2.70 billion | YouTube Shopping features roll out |
| 2024 | 2.50 billion | Connected TV watching surges |
| 2025 | 2.54–2.58 billion | $60B annual revenue milestone |
| 2026 | 2.58 billion | Current figure (May 2026) |
Sources: DemandSage 2026, Backlinko 2026
YouTube Premium & Paid Tiers
- 125 million YouTube Music + Premium subscribers globally as of 2025 — up from just 18 million in 2019
- Premium subscriptions grew from 80 million (2022) to 100 million (2024) to 125 million (2025) — a 56% increase in three years
- YouTube TV has 9.4 million subscribers in the US (Q1 2025), making it the most subscribed virtual multichannel video programming distributor (vMVPD) in the country
- YouTube Premium is priced at $13.99/month for individuals in the US
What this means for you: YouTube’s user base has doubled since 2013 and shows no plateau. For marketers, this means advertising reach keeps expanding. For creators, it means audience potential is still growing. The platform’s paid tier growth (18M to 125M Premium subs in 6 years) also signals that YouTube users are willing to pay for improved experiences — a behavioral shift with implications for direct monetization strategies.
YouTube User Statistics by Country & Region
India overtook the United States years ago and now holds the top position by a wide margin. But YouTube’s geographic footprint extends far beyond these two countries — Southeast Asia, Latin America, and the Middle East all represent massive and rapidly growing viewer populations. Here is the global breakdown.
Top 20 Countries by YouTube Users
| Rank | Country | Users | Notes |
|---|---|---|---|
| 1 | India | 518 million | Largest YouTube market by a 2:1 margin |
| 2 | United States | 259 million | Highest ad revenue per user |
| 3 | Indonesia | 151 million | Fast-growing Southeast Asian market |
| 4 | Brazil | 149–150 million | Largest market in Latin America |
| 5 | Mexico | 85–86 million | Strong Spanish-language content market |
| 6 | Japan | 78–81 million | #2 country for IAP revenue |
| 7 | Germany | 64–66 million | Largest European market |
| 8 | Vietnam | 62–63 million | Rapid growth fueled by mobile penetration |
| 9 | Philippines | 59–61 million | One of highest per-capita usage rates in Asia |
| 10 | Turkey | 57–59 million | Strong entertainment content demand |
| 11 | Pakistan | 54–59 million | Among fastest-growing markets globally |
| 12 | United Kingdom | 55–57 million | Premium ad market; strong creator ecosystem |
| 13 | France | 51.5 million | Major Western European market |
| 14 | Bangladesh | 49.8 million | Fast-growth South Asian market |
| 15 | Egypt | 49.3 million | Largest YouTube market in MENA |
| 16 | Thailand | 47.2 million | High per-capita mobile usage |
| 17 | South Korea | 42.9 million | #3 country for IAP revenue ($7.85M/month) |
| 18 | Italy | 41.2 million | Strong entertainment and music viewership |
| 19 | Spain | 39 million | Key Spanish-language market alongside Mexico |
| 20 | Canada | 33 million | High premium subscriber concentration |
Sources: DemandSage 2026, Backlinko 2026
In-App Purchase (IAP) Revenue by Country (December 2025)
- United States: $889 million in YouTube IAP revenue in December 2025 — by far the largest contributor
- Japan: $261 million — the #2 IAP market, reflecting strong Premium and YouTube Music adoption
- South Korea: $7.85 million — #3 IAP market despite a relatively smaller user base
US Location Demographics
- Urban areas: 85% of adults use YouTube
- Suburban areas: 84% of adults use YouTube
- Rural areas: 81% of adults use YouTube
- The near-uniform adoption across urban, suburban, and rural areas sets YouTube apart from most other social platforms — it has no meaningful geographic blind spots in the US
Geographic insight: India’s 518 million users represent the largest single audience, but the US market generates disproportionately more ad revenue per user. For creators targeting English-language audiences, the US, UK, and Canada are the highest CPM markets — even though they represent a smaller share of total viewers. Southeast Asia and Latin America offer massive reach at lower CPM rates, making them ideal for scale-focused content strategies.
YouTube Demographics 2026: Age, Gender, Income & Education Breakdown
YouTube reaches audiences that most media channels cannot. Its demographic spread is unusually broad — cutting across age groups, income levels, and education backgrounds in ways that make it one of the most versatile advertising and content platforms available. Here is the full demographic breakdown.
Age Demographics: Global Traffic Data
| Age Group | Share of Users | Notes |
|---|---|---|
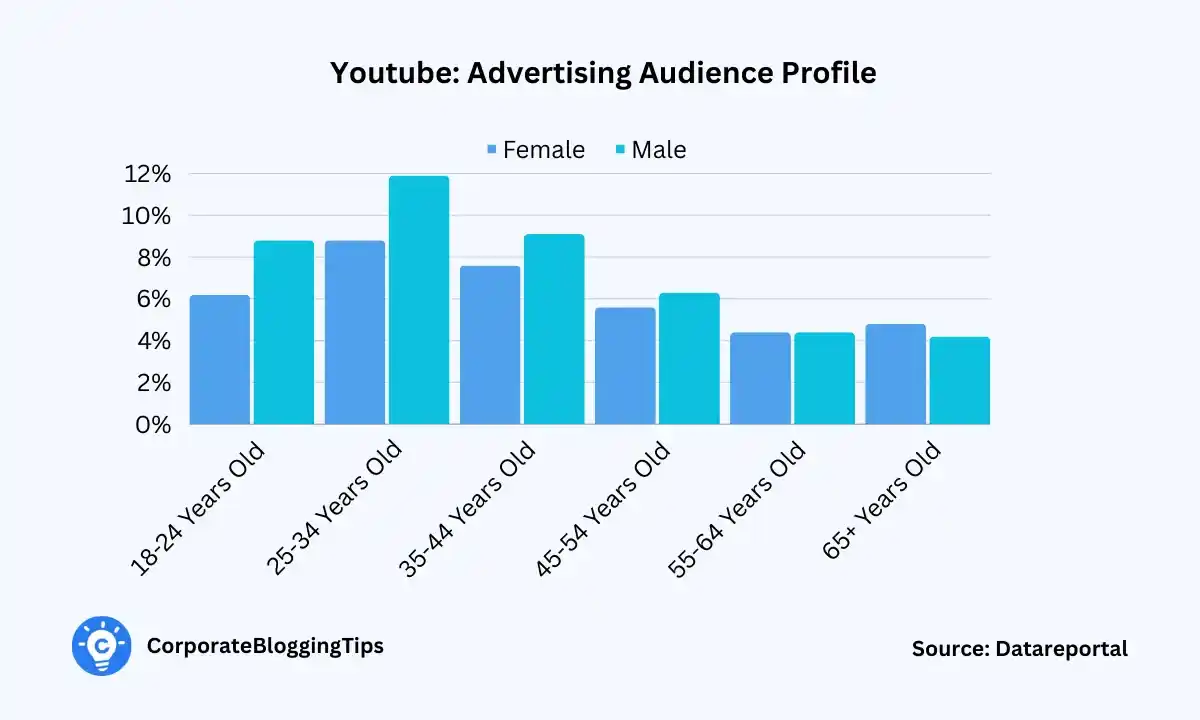
| 18–24 | 15.8% | Heavy Shorts consumers; music and gaming focus |
| 25–34 | 21.7% | Largest single age group; highest commercial intent |
| 35–44 | 18.5% | Strong How-to and finance content viewers |
| 45–54 | 14.0% | Growing news and education viewership |
| 55–64 | 9.9% | Fastest-growing older cohort on the platform |
| 65+ | 9.5% | Connected TV usage driving adoption in this group |
Generational Breakdown (US Users)
| Generation | Birth Years | Share of US YouTube Users |
|---|---|---|
| Gen Z | 1997–2012 | 25.1% |
| Millennials | 1981–1996 | 25.5% |
| Gen X | 1965–1980 | 19.9% |
| Baby Boomers | 1946–1964 | 15.0% |
- Globally, approximately 56% of YouTube users are aged 18–34
- 50.6% of users are Gen Z and Millennials combined — giving YouTube enormous influence over the two most commercially targeted consumer generations
- The 25–34 age group is the largest single cohort on YouTube traffic data, accounting for 28.42% of all website traffic
Gender Demographics
- Globally: 53–54.3% male, 45.7–47% female — a modest male skew that varies by content category
- United States: 48.8% male, 51.2% female — the US audience actually skews slightly female
- United Kingdom: approximately 50/50 gender split
- YouTube traffic data shows 60.91% male, 39.09% female among website visitors (April 2026) — reflecting that male users may visit more frequently, not just more numerously
Income Demographics (US Adults)
| Annual Household Income | % Who Use YouTube |
|---|---|
| $100,000+ | 90% |
| $70,000–$99,999 | 87% |
| $30,000–$69,999 | 79% |
| Under $30,000 | 78% |
Education Demographics (US Adults)
| Education Level | % Who Use YouTube |
|---|---|
| More than college (graduate degree) | 90% |
| Some college education | 87% |
| High school or less | 79% |
What the demographics tell advertisers: YouTube is one of the few platforms where high-income, highly-educated audiences are MORE likely to use it than lower-income groups — the opposite of what many assume about video platforms. The 90% adoption rate among $100K+ households makes YouTube a premium advertising environment for financial services, technology, travel, and luxury categories where other social platforms struggle to reach affluent audiences reliably.
YouTube Engagement Statistics: How 2.58B Monthly Active Users Actually Watch
Reach numbers tell you who is on a platform. Engagement numbers tell you how deeply they are using it. YouTube’s engagement statistics are where the platform truly stands apart — its session duration and daily watch time metrics beat every other social media platform by a significant margin.
Daily Watch Time & Session Duration
- Average daily usage: 48 minutes 42 seconds (2024) — up from 39 minutes 42 seconds in 2019, representing a 23% increase in five years
- Average session duration: 18 minutes 48 seconds — the highest session duration of all major social media platforms
- Over 27 hours per month is spent by the average user on the YouTube Android app (2024)
- YouTube users collectively watch over 1 billion hours of video every single day
Time Spent: YouTube vs Other Platforms (Android, Q4 2023)
| Platform | Hours Per Month (Android) |
|---|---|
| TikTok | 31h 47min |
| YouTube | 27h 43min |
| 19h 27min | |
| 16h 58min | |
| 16h 28min |
Note: While TikTok edges YouTube in total monthly Android time, YouTube’s much higher session duration (18 min 48 sec vs TikTok’s shorter per-session clips) suggests deeper, more intentional viewing behavior.
Daily Watch Time Trend (2019–2024)
| Year | Average Daily Watch Time |
|---|---|
| 2019 | 39 min 42 sec |
| 2020 | ~43 min (pandemic spike) |
| 2021 | ~45 min |
| 2022 | ~46 min |
| 2023 | ~47 min |
| 2024 | 48 min 42 sec |
Device Usage Breakdown
- Mobile devices: 63–69% of all views — the majority of YouTube viewing happens on smartphones
- Connected TV / other: 14% of views — smart TVs and streaming devices are the fastest-growing viewing category
- Desktop: 12% of views
- Tablet: 8% of views
- Gaming console: 3% of views
Connected TV trend to watch: While mobile dominates overall viewing volume, Connected TV (CTV) is the fastest-growing surface for YouTube. This has major implications for ad buyers — CTV ad placements command premium CPMs because the larger screen commands more attention. For creators, it means content formatted for TV screens (longer videos, high production quality) is increasingly valuable alongside mobile-first Shorts content.
Search Behavior
- YouTube handles over 3 billion searches per day, making it the second-largest search engine in the world after Google
- 500 hours of video are uploaded to YouTube every minute — the platform adds more content in a single day than most streaming services offer in total
- YouTube search is particularly strong for “how-to” queries, tutorials, product reviews, and music — categories where video answers outperform text results
- YouTube’s search infrastructure is so powerful that it operates as a standalone discovery engine — which is why access to YouTube at scale (for research, competitor analysis, or multi-region content audits) has led to a growing market for dedicated YouTube proxy providers that let teams bypass geographic restrictions and IP rate limits
YouTube Content Statistics: Upload Volume, Shorts & Top Videos
The scale of content on YouTube defies easy comprehension. Half a billion daily active users are not just watching content — millions of them are creating and uploading it constantly. These content statistics show the platform’s supply side and the category breakdown of what people actually watch.
Content Upload & Volume
- 500 hours of video uploaded every minute — equal to 30,000 hours per hour, or approximately 720,000 hours per day
- 20 million videos uploaded daily across all creators and content types
- The sheer volume means discoverability is intensely competitive — the vast majority of uploaded videos receive fewer than 100 views
YouTube Shorts
- Shorts is the fastest-growing format on YouTube, introduced globally in 2021 and now embedded as a core discovery mechanism for new channels
- Creators who post Shorts regularly tend to see accelerated subscriber growth on their main channels — Shorts acts as a top-of-funnel acquisition tool for long-form content
- Unlike TikTok where the algorithm heavily weights new accounts, YouTube Shorts benefits from YouTube’s existing search infrastructure — a Short can surface in both the Shorts feed and traditional search results, doubling distribution potential
Most-Viewed Videos of All Time
| Rank | Video | Views |
|---|---|---|
| 1 | Baby Shark Dance (Pinkfong) | 16.22 billion |
| 2 | Despacito (Luis Fonsi) | 8.81 billion |
| 3 | Wheels on the Bus (Cocomelon) | 7.93 billion |
Content Categories & Viewership Patterns
- Music videos dominate all-time view counts — 7 of the top 10 most-viewed videos ever are music content
- Children’s content (Baby Shark, Cocomelon, Vlad and Niki) commands enormous view counts driven by repeat viewing behavior
- Gaming content is one of the most-subscribed categories, driven by live streaming, walkthroughs, and commentary
- Education and How-to content sees some of the highest watch-time ratios — viewers actively seek step-by-step tutorials to completion
- News and politics viewership has grown dramatically, with YouTube now a primary news source for many 18–34 year-olds
- Beauty, lifestyle, and vlogs remain perennially strong categories for brand sponsorships and affiliate revenue
Content Moderation Data
- 34% of removed videos are taken down for child safety violations — the most common removal reason
- 17.1% removed for harmful or dangerous content
- 16.4% removed for violent or graphic material
- 12.1% removed for nudity or sexual content
- 8.3% removed for harassment and cyberbullying
YouTube Shorts opportunity: Short-form video on YouTube represents one of the clearest organic reach opportunities for creators and brands in 2026. Unlike TikTok where the algorithm heavily weights new accounts, YouTube Shorts benefits from YouTube’s existing search infrastructure — a Short can surface in both the Shorts feed and traditional search results, doubling distribution potential.
YouTube Revenue Statistics: $60 Billion in 2025
YouTube’s revenue growth is one of the most impressive stories in media over the past decade. What started as an ad-supported video site has become a multi-revenue-stream business generating $60 billion annually — putting it in the same league as major broadcast networks and streaming services combined.
Annual Revenue (2020–2025)
| Year | Total Revenue | YoY Change |
|---|---|---|
| 2020 | $19.7 billion | Pandemic ad market volatility |
| 2021 | $28.8 billion | +46% — post-pandemic ad surge |
| 2022 | $29.24 billion | +1.5% — macro slowdown impact |
| 2023 | $31.5 billion | +7.7% — recovery begins |
| 2024 | $36.1 billion | +14.6% — strong ad market rebound |
| 2025 | $60 billion total ($40.35B ads) | +66% — includes Premium & YouTube TV |
Source: DemandSage 2026
H1 2025 Revenue Breakdown
- $18.72 billion in YouTube ad revenue in H1 2025 — an 11.6% year-over-year increase
- YouTube ads accounted for 10.03% of Alphabet’s total revenue in H1 2025 — a significant share of Google’s parent company
- Full-year 2025 advertising revenue totaled $40.35 billion, with the remainder of the $60B total coming from YouTube Premium subscriptions, YouTube TV, and in-app purchases
Revenue Streams
- Advertising: The dominant revenue stream — skippable ads, non-skippable ads, bumper ads, overlay ads, and display ads across the platform
- YouTube Premium: $13.99/month individual subscription (US); 125 million subscribers globally generating substantial subscription revenue
- YouTube TV: 9.4 million US subscribers at approximately $72.99/month — a meaningful pay-TV revenue source
- In-App Purchases (IAP): Channel memberships, Super Chats, Super Stickers, and tipping during live streams — US alone generated $889M in December 2025
- YouTube Shopping: Product placement and affiliate commerce integrations — a rapidly growing revenue category as YouTube adds shopping features across formats
Revenue context: YouTube’s $60 billion in 2025 revenue exceeds the combined revenue of Netflix ($39B in 2024) and Disney’s streaming segment. For advertisers, this scale means YouTube can consistently fill ad inventory across every content category — reach is never a constraint. If you want to benchmark this growth against another fast-moving digital sector, our SaaS statistics article shows how software-as-a-service platforms — many of which advertise heavily on YouTube — have scaled alongside this ad revenue surge.
YouTube Creator Economy: Earnings, Subscribers & Monetization Statistics
YouTube runs one of the largest creator monetization ecosystems in the world. Understanding creator earnings, the most-subscribed channels, and how the Partner Program works gives context to both the opportunity and the difficulty of building a YouTube business from scratch.
Most-Subscribed YouTube Channels (May 2026)
| Rank | Channel | Subscribers | Category |
|---|---|---|---|
| 1 | MrBeast | 483 million | Entertainment / Challenges |
| 2 | T-Series | 311 million | Indian Music & Films |
| 3 | Cocomelon – Nursery Rhymes | 201 million | Children’s Education |
| 4 | SET India | 189 million | Indian TV Network |
| 5 | Vlad and Niki | 149 million | Children’s Entertainment |
Note: MrBeast’s 483 million subscribers make him the most-subscribed individual creator in YouTube history, surpassing T-Series (a corporate channel) to claim the overall #1 spot.
Creator Earnings
- Creators earn $1.61 to $29.30 per 1,000 views — the wide range reflects differences in content category, audience geography, and advertiser demand
- YouTube pays creators 55% of all ad revenue generated on their content; YouTube keeps the remaining 45%
- To join the YouTube Partner Program (YPP), creators need a minimum of 1,000 subscribers and 4,000 watch hours in the past 12 months — or 1,000 subscribers and 10 million Shorts views in 90 days
- Finance, business, and technology channels typically earn at the upper end of the CPM range ($15–$29 per 1,000 views) due to high advertiser competition for those audiences
- Entertainment, gaming, and children’s content typically earns at the lower end ($1.61–$5 per 1,000 views) despite high view counts
Earnings Breakdown by Category (Estimated CPM Range)
| Content Category | Estimated CPM Range |
|---|---|
| Finance & Investing | $12–$29.30 per 1,000 views |
| Technology & Software | $10–$22 per 1,000 views |
| Business & Marketing | $8–$20 per 1,000 views |
| Health & Fitness | $6–$15 per 1,000 views |
| Lifestyle & Beauty | $4–$12 per 1,000 views |
| Gaming | $2–$7 per 1,000 views |
| Entertainment / Comedy | $1.61–$5 per 1,000 views |
| Children’s Content | $1.61–$4 per 1,000 views |
Additional Revenue Streams for Creators
- Channel Memberships: Viewers pay a monthly fee for exclusive badges, emojis, and content — available once a channel reaches 1,000 subscribers
- Super Chat and Super Stickers: Live stream features where viewers pay to highlight their messages — the US generated $889M in December 2025 alone from IAP, much of it via Super Chat
- YouTube Shopping: Creators can tag products directly in videos, driving affiliate and direct purchase revenue without leaving the platform
- Merchandise shelf: Creators can display products from Spreadshop, Teespring, and other platforms directly under their videos
- Brand sponsorships: For creators with 100K+ subscribers, brand deals typically exceed AdSense revenue and can range from $1,000 to $500,000+ per integration
Creator economy reality check: Only a small fraction of YouTube channels generate meaningful AdSense income. With 20 million videos uploaded daily, the platform is intensely competitive. The creators who build sustainable businesses on YouTube typically combine AdSense with brand sponsorships, merchandise, memberships, and courses — treating AdSense as one revenue stream among several, not the primary one. Many also extend their brand to a companion blog: our blogging statistics roundup shows how content creators who pair written content with video consistently grow their audience and revenue faster than those who rely on a single channel.
YouTube Advertising Statistics: Reach, CPM & ROI in 2026
YouTube advertising reaches more people than most traditional media channels at a fraction of the cost. These statistics show what makes YouTube such a powerful platform for paid media — and where the real advertising opportunities lie in 2026.
Advertising Reach
- YouTube’s potential advertising reach covers 2.53 billion+ accounts globally
- YouTube ads can reach 46% of internet users worldwide in a single campaign
- YouTube reaches more US adults aged 18–49 in a week than any single cable or broadcast TV network
- In the US alone, YouTube’s ad reach covers approximately 248 million people
- YouTube is the #2 digital advertising platform in the US after Google Search
Ad Revenue Metrics
- YouTube advertising generated $40.35 billion in 2025 — a record high
- YouTube ad revenue represented 10.03% of Alphabet’s total revenue in H1 2025
- The platform consistently shows double-digit year-over-year ad revenue growth when the macro ad market is healthy
Ad Formats Available
- Skippable in-stream ads: Play before, during, or after videos; viewers can skip after 5 seconds — the most common format
- Non-skippable in-stream ads: 15–20 seconds maximum; cannot be skipped — highest completion rate
- Bumper ads: 6-second non-skippable ads; excellent for brand awareness at low CPM
- Overlay ads: Semi-transparent banner ads that appear at the bottom of the video
- Sponsored cards: Contextually relevant product cards displayed during videos
- Discovery/search ads: Appear in search results and next-to-watch recommendations
- Connected TV ads: Full-screen, higher-impact placements for streaming on smart TVs
CPM Benchmarks by Market
- United States: Average CPM ranges from $5–$30 depending on category and targeting
- UK and Canada: $4–$20 CPM range — premium English-language markets
- India: $0.50–$2 CPM — low CPM despite massive reach; high volume makes up for low unit pricing
- Southeast Asia: $1–$4 CPM range — growing rapidly as local advertiser spend increases
Advertiser ROI Data
- Only 9% of small US businesses currently use YouTube for marketing — representing a significant underutilization given the platform’s targeting capabilities
- YouTube advertising generated $40.35 billion in ad revenue in 2025 — accounting for roughly 10% of Alphabet’s total revenue in H1 2025
- YouTube’s H1 2025 ad revenue reached $18.72 billion, an 11.6% year-over-year increase — consistent growth even as many social media ad markets face headwinds
Small business opportunity: The fact that only 9% of small US businesses use YouTube advertising despite 90% of high-income adults using the platform suggests a significant market inefficiency. YouTube’s minimum daily ad budget can be as low as $10, and geographic, demographic, and interest-based targeting allows small businesses to reach highly relevant local audiences at lower costs than most traditional advertising channels.
YouTube vs TikTok vs Netflix: Platform Comparison Statistics 2026
YouTube does not exist in isolation. TikTok, Instagram Reels, Netflix, and Twitch all compete for screen time and ad dollars. These comparisons show where YouTube stands relative to its closest rivals and where each platform holds genuine advantages.
YouTube vs TikTok
| Metric | YouTube | TikTok | Winner |
|---|---|---|---|
| Monthly Active Users | 2.58 billion | 1.99 billion | YouTube |
| Avg. Daily Time (Android) | 27h 43min/month | 31h 47min/month | TikTok |
| Session Duration | 18 min 48 sec | ~5–8 min avg | YouTube |
| Short-form video | Shorts (rapidly growing format) | Core product | Tie |
| Annual Ad Revenue (2025) | $40.35 billion | ~$23 billion (per eMarketer 2025 estimates) | YouTube |
| Content longevity (SEO) | Strong — content ranks for years | Weak — content fades in days | YouTube |
| Creator earnings/1K views | $1.61–$29.30 | $0.02–$0.04 (Creator Fund) | YouTube (significantly) |
| Regulatory risk | Low (Google-owned) | High (US ban discussions) | YouTube |
Winner for reach & revenue: YouTube | Winner for total time spent & short-form virality: TikTok | Winner for creator monetization: YouTube (by a wide margin)
YouTube vs Netflix & Streaming Services
| Metric | YouTube | Netflix | Winner |
|---|---|---|---|
| Monthly Active Users | 2.58 billion | ~302 million subscribers (Netflix Q4 2024 earnings) | YouTube (8x more users) |
| Annual Revenue (2025) | $60 billion | ~$39 billion (Netflix 2024 annual report) | YouTube |
| Content model | User-generated + YT Originals | Licensed + Original productions | Different strengths |
| Free tier | Yes (ad-supported) | Yes (limited markets) | YouTube (broader) |
| Daily hours watched | 1 billion+ hours | ~100 million+ hours (Netflix Q4 2024 earnings) | YouTube |
| US Living Room viewing | Growing rapidly (CTV) | Dominant TV platform | Netflix (currently) |
| Advertising revenue | $40.35 billion | ~$2 billion | YouTube (20x) |
Winner for user base & ad revenue: YouTube | Winner for premium subscription entertainment: Netflix | Winner for living room TV dominance: Netflix (though YouTube is closing the gap fast)
🏆 Choose YouTube When
- You need the broadest possible reach across all age groups
- You want content that ranks in search and compounds over time
- You are a creator who wants diverse monetization options
- You want both short-form (Shorts) and long-form video in one platform
- You are targeting high-income, highly-educated audiences
- You want an advertising platform with the most mature targeting capabilities
🔍 Choose Competitors When
- Viral short-form is the primary goal (TikTok has stronger short-form algorithm)
- You are targeting Gen Z with cultural/trend-based content (TikTok, Instagram Reels)
- You need premium scripted entertainment (Netflix, Disney+)
- You are focused on live gaming streams (Twitch still has stronger live culture)
- You want a professional B2B audience (LinkedIn video)
- You want Instagram’s visual commerce features (Instagram Reels + Shopping)
YouTube Statistics: Frequently Asked Questions
How many people use YouTube in 2026?
YouTube has 2.58 billion monthly active users as of 2026. That makes it the 4th largest social media platform globally by active user count, behind Facebook (3.07B), WhatsApp (3B), and Instagram (3B). Approximately 42.8% of all global internet users access YouTube at least once per month. Daily active users number around 122 million.
What is YouTube’s total revenue in 2025?
YouTube generated $60 billion in total revenue in 2025, with $40.35 billion coming from advertising alone. The remainder came from YouTube Premium subscriptions (125M subscribers at $13.99/month), YouTube TV (9.4M US subscribers), and in-app purchases like Super Chats and channel memberships. For context, YouTube’s H1 2025 advertising revenue alone was $18.72 billion — an 11.6% year-over-year increase.
Which country has the most YouTube users?
India has the most YouTube users with approximately 518 million — nearly double the US figure of 259 million. The top 5 countries by user count are India (518M), United States (259M), Indonesia (151M), Brazil (149M), and Mexico (86M). However, while India leads in user count, the United States generates far more ad revenue per user due to higher advertiser CPMs — the US alone recorded $889 million in YouTube IAP revenue in December 2025.
How long do people spend on YouTube each day?
The average YouTube user spends 48 minutes and 42 seconds per day on the platform (2024 data), up from 39 minutes 42 seconds in 2019. The average session duration is 18 minutes 48 seconds — the highest session duration of any major social media platform. Monthly, that works out to over 27 hours per month on the YouTube Android app alone. Collectively, users watch over 1 billion hours of YouTube video every single day.
How much do YouTube creators earn per 1,000 views?
Creator earnings range from $1.61 to $29.30 per 1,000 views, depending heavily on the content category and the geographic distribution of the audience. Finance, business, and tech channels earn at the high end ($12–$29.30/1K views); gaming, entertainment, and children’s content tends to earn $1.61–$5/1K views. YouTube pays creators 55% of the ad revenue generated on their content, keeping 45%. Most financially successful creators treat AdSense as one revenue stream among several, supplementing it with brand sponsorships, memberships, merchandise, and digital products.
Who is the most subscribed YouTube channel in 2026?
MrBeast leads with 483 million subscribers as of May 2026 — making him the most-subscribed individual creator in YouTube history. The top 5 most-subscribed channels are:
- MrBeast — 483 million subscribers
- T-Series — 311 million subscribers
- Cocomelon — 201 million subscribers
- SET India — 189 million subscribers
- Vlad and Niki — 149 million subscribers
What percentage of YouTube views come from mobile devices?
63–69% of all YouTube views come from mobile devices, making mobile the dominant viewing platform. Connected TV (smart TVs, streaming sticks) accounts for approximately 14% and is the fastest-growing viewing surface. Desktop accounts for 12%, tablets 8%, and gaming consoles 3%. For creators, this means mobile-optimized thumbnails and titles are essential — but connected TV is increasingly important for longer, high-production content since TV screens reward quality video and audio.
How many videos are uploaded to YouTube every day?
500 hours of video are uploaded to YouTube every minute — equivalent to approximately 20 million individual videos per day. This level of content volume is both the platform’s strength (nearly unlimited content for every interest) and its challenge for creators (extreme competition for discovery). The vast majority of uploaded videos receive fewer than 1,000 views. Discoverability depends almost entirely on YouTube SEO (title, description, tags, thumbnails) and the initial engagement signals the platform uses to decide whether to push content further.
What is YouTube Shorts and how does it help creators?
YouTube Shorts is the platform’s short-form vertical video format, launched globally in 2021. It has become a central discovery mechanism on YouTube, benefiting from the platform’s existing search infrastructure — a Short can surface in both the Shorts feed and traditional search results. Creators who post Shorts tend to gain subscribers faster, as the format exposes their content to new audiences who may then visit the main channel for long-form videos.
What is YouTube’s market position compared to TikTok and Netflix?
YouTube is significantly larger than both by most metrics. Against TikTok: YouTube has 2.58B MAU vs TikTok’s 1.99B, generates $40.35B in ad revenue vs TikTok’s estimated ~$23B (per eMarketer 2025 estimates), and pays creators $1.61–$29.30/1K views vs TikTok’s $0.02–$0.04. Against Netflix: YouTube has 8x more users (2.58B vs 302M subscribers per Netflix Q4 2024 earnings), generates more revenue ($60B vs ~$39B per Netflix 2024 annual report), and users watch 10x more hours daily (1B+ vs ~100M+ per Netflix Q4 2024 earnings). Netflix remains the leader for premium scripted TV entertainment, but YouTube dominates on total audience size, watch time, and advertising revenue.
What are the YouTube statistics for income demographics in the US?
YouTube has unusually high adoption across all income brackets in the US:
- $100K+ households: 90% use YouTube
- $70K–$99K households: 87% use YouTube
- $30K–$69K households: 79% use YouTube
- Under $30K households: 78% use YouTube
This near-uniform high adoption across income groups — with the highest earners being the most likely to use YouTube — makes it one of the most effective platforms for reaching premium audiences at scale. The same pattern holds for education: 90% of graduate-degree holders use YouTube versus 79% of those with a high school diploma or less.
What is the most-viewed video on YouTube of all time?
“Baby Shark Dance” by Pinkfong holds the record with 16.22 billion views — making it by far the most-watched video in the platform’s history. The top 3 most-viewed videos of all time are Baby Shark Dance (16.22B views), Despacito by Luis Fonsi (8.81B views), and Wheels on the Bus by Cocomelon (7.93B views). The dominance of children’s content and music in the all-time view charts reflects how both categories drive repeat viewing — a child watching the same video dozens of times, or a music video being replayed — far more than other content types.
YouTube Statistics Summary: What 150+ Data Points Tell Us
After reviewing 150+ data points spanning users, geography, demographics, engagement, content, revenue, the creator economy, advertising, and competitive position, the picture is consistent: YouTube is not just large — it is foundational to how the internet works.
The platform’s 2.58 billion monthly users include 90% of US high-income households, the world’s most engaged Gen Z and Millennial audiences, and a dominant position in India, Southeast Asia, and Latin America — regions representing the bulk of global internet growth in the coming decade. Revenue growth from $19.7 billion (2020) to $60 billion (2025) in five years reflects both advertising market resilience and the successful diversification into Premium subscriptions, YouTube TV, and in-app purchases.
For creators, the platform offers unmatched monetization infrastructure relative to any competitor — a 55% revenue share, a growing suite of direct fan monetization tools (Super Chat, memberships, YouTube Shopping), and content longevity that short-form platforms simply cannot match. The challenge is discoverability in an environment where 20 million videos are uploaded daily and competition for algorithm-driven reach is intense.
For advertisers, YouTube combines the targeting sophistication of Google’s data infrastructure with the immersive impact of video — reaching audiences that traditional TV can no longer reliably access. With only 9% of small US businesses currently advertising on YouTube, the gap between the platform’s potential and its actual small-business advertiser penetration remains one of the clearest market opportunities in digital marketing.
✓ What the YouTube Statistics Confirm
- 2.58B MAU — the broadest video audience on earth
- $60B annual revenue — financially dominant platform
- 48 min 42 sec average daily watch time — deep user engagement
- 90% adoption among $100K+ US households — premium audience
- YouTube Shorts: rapidly growing short-form format embedded across search and feed — short-form is here to stay
- Creator earnings of up to $29.30/1K views in high-CPM niches
- 18 min 48 sec session duration — highest of all social platforms
- #2 search engine globally — search-driven discoverability is real
✗ What the Statistics Also Show
- Extreme content competition: 500 hours uploaded per minute
- Low base creator earnings ($1.61/1K views) in entertainment niches
- 30% of YouTubers struggle to find and engage their target audience
- TikTok still leads in raw monthly time spent on Android
- Only 9% of small businesses use YouTube — low business adoption
- IAP revenue highly concentrated in US and Japan
- Connected TV growing fast but Netflix still leads living room viewing
Ready to Put These YouTube Statistics to Work?
Whether you are building a creator strategy, planning ad campaigns, or writing about YouTube — Hostinger gives you the fast, affordable hosting you need to publish and grow your content online.
Start Publishing with Hostinger →